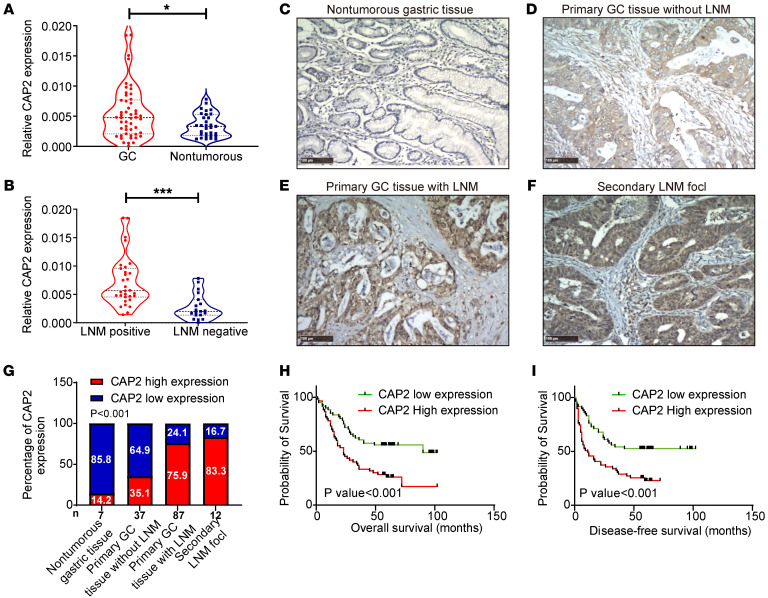
Figure 1. CAP2 is upregulated in human GC tissues and is associated with a poor prognosis.
(A) CAP2 mRNA expression in GC tissues and nontumorous gastric tissues was detected with reverse transcriptase PCR (RT-PCR) (n[GC] = 50, n[Nontumorous] = 31). (B) CAP2 mRNA expression in GC tissues with and without LNM was detected by qPCR (n[positive] = 31, n[negative] = 19). The violin plot shows the mean and interquartile range, and the width shows the probability density. (C–F) Expression of CAP2 protein in GC paraffin-embedded tissue was detected by IHC. Representative images of CAP2 expression in normal gastric mucosa and GC tissues of different grades. Original magnification, ×100; scale bars: 100 μm. (G) Percentage of the high and low CAP2 expression levels in GC samples with different metastatic status and in normal gastric mucosal samples. (H and I) Kaplan-Meier curves of overall survival and disease-free survival for CAP2 expression. The cutoff value was obtained using the median analysis. (The numbers of patients with high and low CAP2 expression were equal. n[low] = 61, n[high] = 61.) Two-tailed unpaired Student’s t test (A and B), χ2 test (G), log-rank test (H and I). *P < 0.05, ***P < 0.001.

