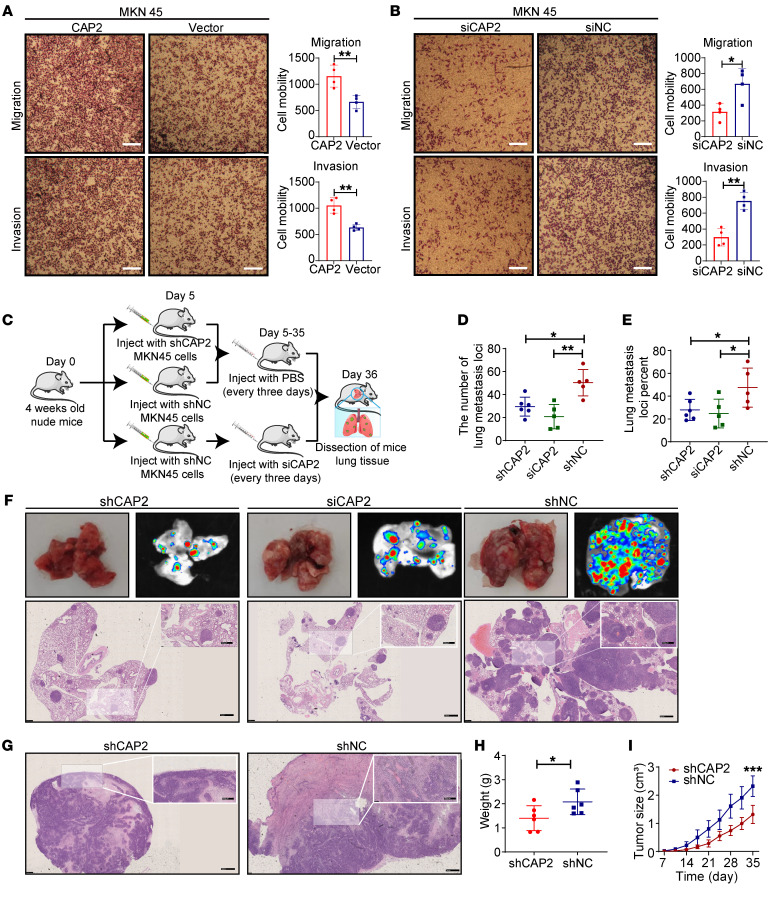
Figure 3. CAP2 promotes GC progression.
(A and B) The migration and invasion ability of MKN45 cells was determined by Transwell assay. Original magnification, ×40; scale bar: 200 μm (n = 4). (C) GC cells were injected into the tail vein of mice to obtain lung xenografts. After LV-NC (n = 5) and LV-shCAP2 (n = 6) were injected into the tail vein of mice, the siCAP2 group (n = 5) was treated with siRNA every 3 days. (D and E) Number of lung transplanted tumors (D) and the ratio of transplanted tumor/normal lung tissue area (E) in nude mice. (F) Representative photographs of lung metastases on day 36. Scale bars: 1 mm; 500 μm (insets). (G) H&E staining showed that the LV-shCAP2 group had an intact capsule, while the LV-shNC group had local infiltration. Scale bars: 1 mm; 500 μm (insets). (H and I) LV-shCAP2 or negative control was used for mouse subcutaneous tumorigenesis experiments. At 36 days after the subcutaneous injection, tumor weight was measured (H). Tumor volumes were measured weekly, and tumor growth curves were drawn (I). Data are presented as the mean ± SD. Two-tailed unpaired Student’s t test (A, B, and H), 1-way ANOVA with Tukey’s multiple-comparison test (D and E), 2-way ANOVA test (I). *P < 0.05, **P < 0.01, ***P < 0.001.

