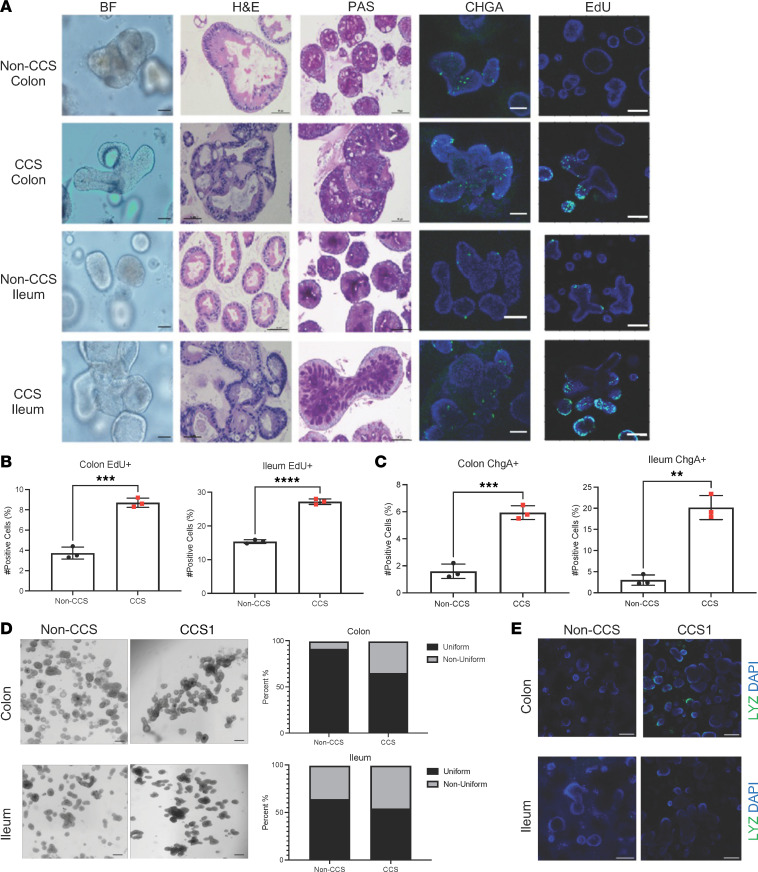
Figure 2. CCS1 HIOs are more proliferative and have increased EECs.
(A) CCS1 and non-CCS HIOs morphology was assessed using bright field (BF), H&E, and PAS staining. Numbers of EECs were assessed with an anti-chromogranin A (CHGA) antibody (green). Proliferation was assessed by pulsing the HIOs with EdU and detecting uptake using the ClickIt EdU Imaging Kit (green) (n = 3). Images were taken at ×20 magnification (scale bars: 100 μm). (B and C) Flow cytometric detection of CHGA+ and EdU+ cells in each culture. Bars represent mean ± SD (n = 3). (D) Bright field image of non-CCS and CCS1 organoids. Images were taken at ×4 magnification (scale bars: 200 μm). Graphs quantitate percentage of HIOs in each culture with a uniform (less than 2 buds) and nonuniform morphology (3 or more buds) from the number of organoids within each well. (E) CCS1 and non-CCS HIOs were stained with LYZ (green) to mark Paneth-like cells. Images were taken at ×10 magnification (scale bars: 50 μm). ****P < 0.0001; ***P < 0.0005; **P < 0.005, determined using a t test with Welch’s correction.

