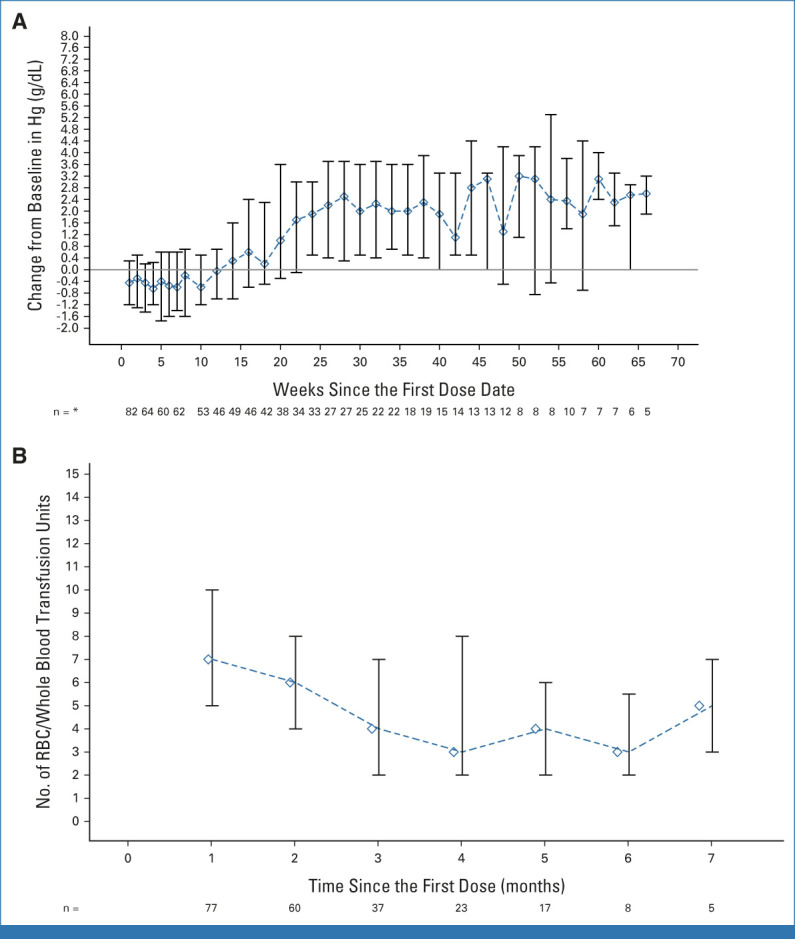
FIG 1.

Hb change from baseline and RBC/whole blood transfusion over time. (A) Hb (g/dL) change from baseline over time. Median (IQR) shown for all patients (n = 87). Numbers below the graph indicate the number of patients with Hb assessment at that time point. (B) RBC/whole blood units transfused over time in patients remaining on treatment from the overall study population (n = 87); median (IQR). Numbers below the graph indicate the number of patients who received a transfusion at that time point. *Time points with at least five patients. Hb, hemoglobin.
