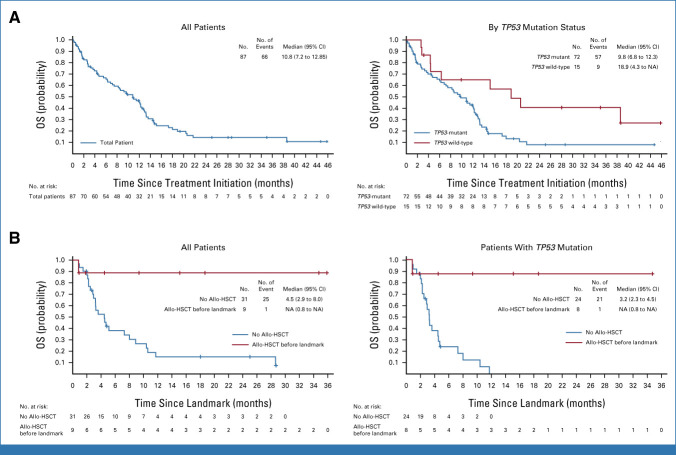
FIG 3.
Kaplan-Meier curves. (A) OS of all patients (left) and by TP53 mutation status (right); (B) OS of patients who received allo-HSCT and patients who did not, including all patients (left), and patients with TP53 mutations (right) using landmark analysis to control for lead-time bias, with 10 months as the landmark time point to include all patients with TP53 mutations who received allo-HSCT. Patients who discontinued or were lost to follow-up before the landmark time point were excluded from the analyses. The allo-HSCT group includes all patients who had allo-HSCT by the landmark time point. The no allo-HSCT group includes all patients who did not receive allo-HSCT or received allo-HSCT after the landmark time point (n = 1). Among patients bridged to allo-HSCT, the median (range) age was 68 (51-73) years, and ECOG performance status at screening was 0 in 3 of 10 (30%), 1 in 5 of 10 (50%), and 2 in 2 of 10 (20%). Eight patients had adverse-risk cytogenetics, one had intermediate-I risk, and one had unknown risk; three had AML related to previous chemotherapy or radiation; and seven were RBC transfusion-independent at baseline. Allo-HSCT was entirely at the discretion of the investigator, and patients took off-trial treatment before conditioning, so no additional information is available. Censored patients are represented by vertical tick marks in the Kaplan-Meier curve. Allo-HSCT, allogeneic hematopoietic stem-cell transplantation; ECOG, Eastern Cooperative Oncology Group; NA, not available; OS, overall survival.

