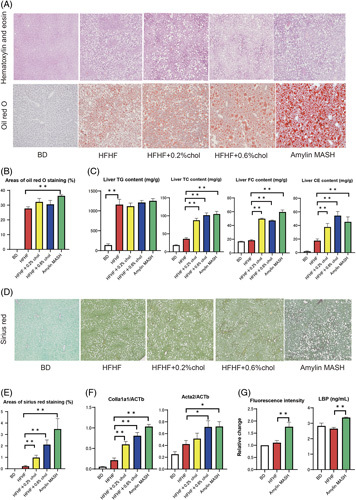
FIGURE 1.

(A) Liver sections from the BD, HFHF, and cholesterol-loaded groups. Representative images of hematoxylin and eosin and Oil Red O staining results. (B) Areas of Oil Red O staining in the livers of mice fed a BD, HFHF, or HFHF diet with added cholesterol (n=6–7). (C) TG, TC, and FC contents were measured in the livers of mice fed a BD, HFHF, or HFHF diet with added cholesterol (n=7–8). (D) Sirius Red staining. (E) Areas of Sirius Red staining in the livers of mice fed a BD, HFHF, or HFHF diet with added cholesterol (n=5–6). (F) Expression of Col1α1 and ACTA2 mRNA in mice fed a BD, HFHF, or HFHF diet supplemented with cholesterol (n=7–8). (G) Fluorescence intensity (n=5) and lipopolysaccharide-binding protein (LBP, n=6–8) levels in mice fed a BD, HFHF, or HFHF diet supplemented with cholesterol. Data are presented as the mean±SE. Significance was determined using Student t test. *p<0.05, **p<0.01. Abbreviations: amylin MASH, amylin liver metabolic dysfunction-associated steatohepatitis; BD, basal diet; CE, cholesterol ester; Col1a1, collagen 1α1; FC, free cholesterol; HFHF, high-fat high-fructose; LBP, lipopolysaccharide-binding protein; TC, total cholesterol; TG, triglyceride.
