
FIGURE 4.
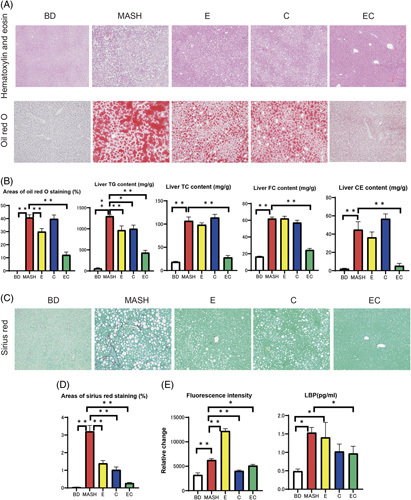
(A) Oil Red O staining results of liver sections from mice fed a basal diet (BD), amylin liver metabolic dysfunction-associated steatohepatitis (amylin MASH) (MASH group), amylin MASH with elobixibat (E) and cholestyramine alone (C), or amylin MASH with a combination of elobixibat and cholestyramine (EC). (B) Oil Red O staining area, triglyceride (TG), total cholesterol (TC), and free cholesterol (FC) contents in the liver samples of mice fed a BD, amylin MASH (MASH group), or amylin MASH with elobixibat and cholestyramine (n=5–7). (C) Sirius Red (SR) staining in the liver. (D) Areas of SR staining in the liver (n=5–7). (E) Fluorescein isothiocyanate and lipopolysaccharide-binding protein (LBP) (n=5–7). Data are presented as the mean±SE. Significance was determined using Student t test. * p<0.05, ** p<0.01. Abbreviations: BD, basal diet; C, cholestyramine; CE, cholesterol ester; E, elobixibat; EC, elobixibat and cholestyramine; FC, free cholesterol; LBP, lipopolysaccharide-binding protein; MASH, metabolic dysfunction-associated steatohepatitis; TC, total cholesterol; TG, triglyceride.