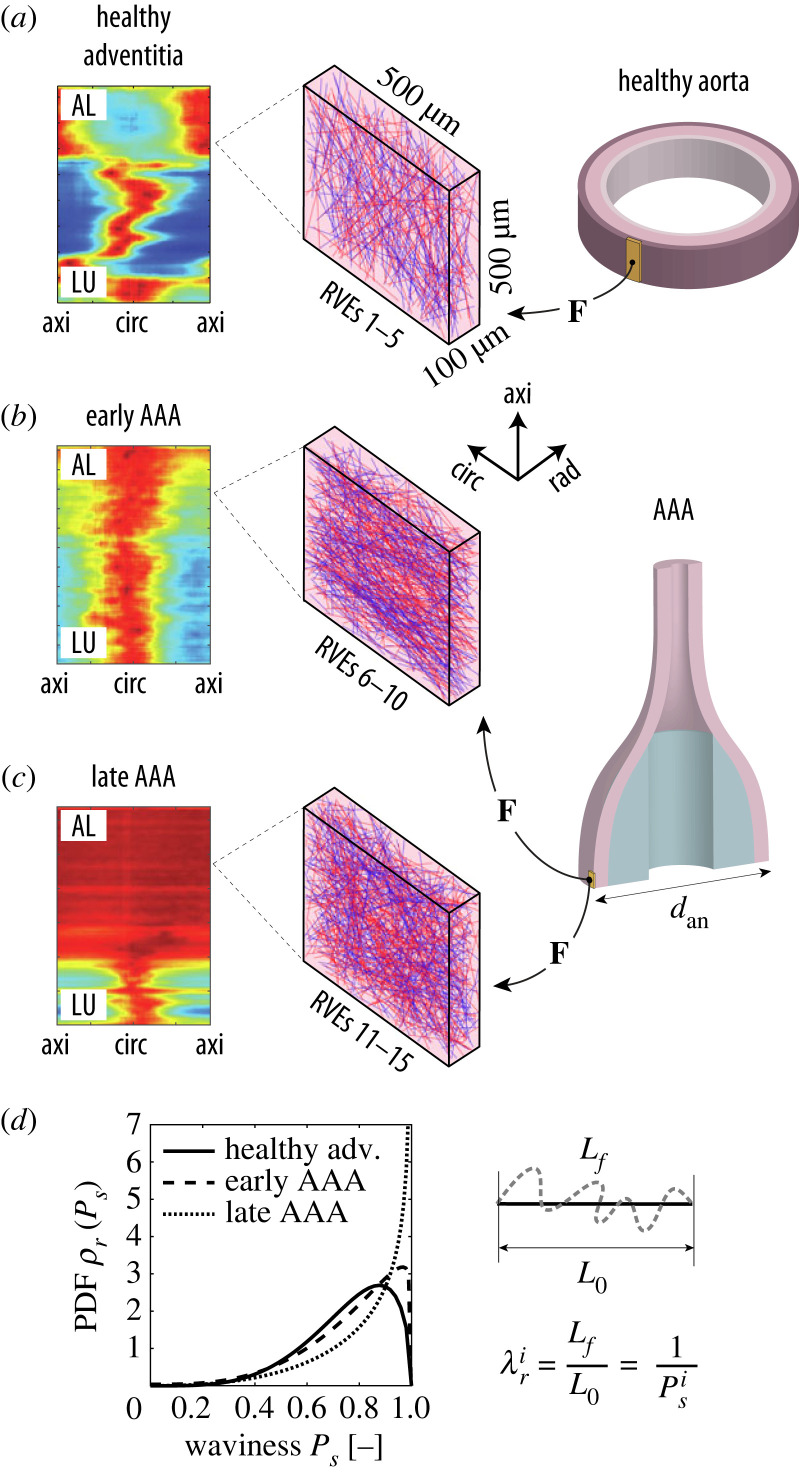
Figure 2.
The micro-scale model consists of representative volume elements (RVEs) of (a) the tunica adventitia of a healthy aorta and AAAs at (b) an early and (c) late microstructural stage. For each stage, five realizations of the microstructure were created and simulated according to the deformation gradients F of the macro-scale models with different diameters dan. The heatmaps in (a–c), reproduced from [39,40], illustrate the characteristic arrangement of collagen fibres for each stage; the colours red and blue indicate high and low concentrations, respectively, of fibres aligned according to a specific in-plane angle between the circumferential (circ) and axial (axi) directions of the tissue for each radial (rad) layer between the luminal (LU) and the abluminal (AL) side of the vessel. (d) Since the two fibre families in the RVEs are represented as (red and blue) straight lines, the waviness of collagen in the real tissue is simulated by assigning a recruitment stretch to each ith fibre by sampling a value Ps (ratio between the end-to-end distance L0 and the arc length Lf of a wavy fibre) from a stage-specific beta distribution [43]; the probability density functions (PDFs) ρr for each stage can be seen in the graph.

