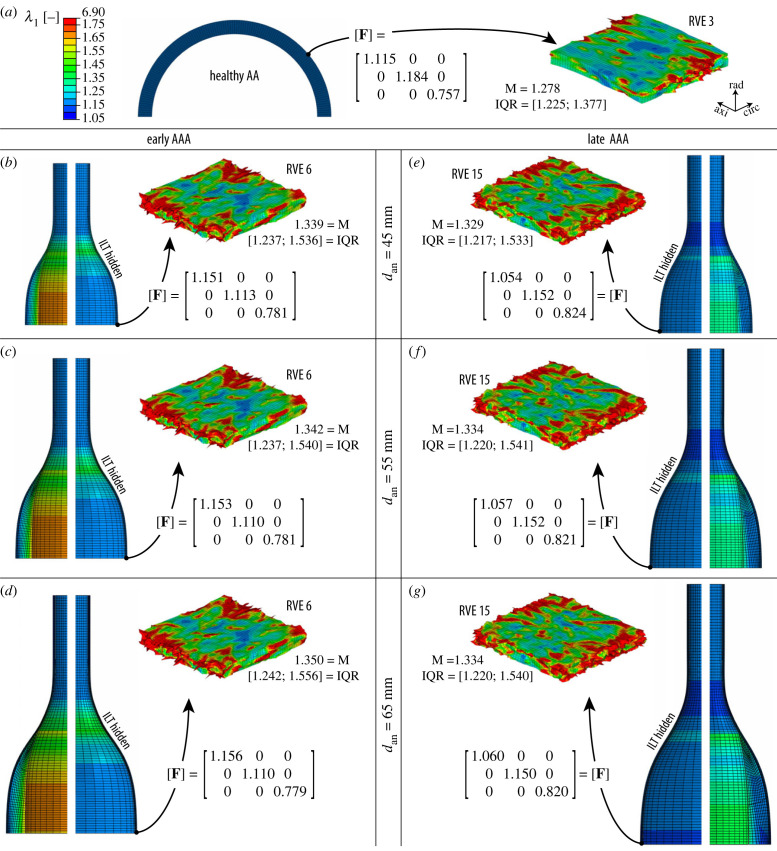
Figure 3.
Maximum principal stretch λ1 of the macro- and micro-scale models of (a) the healthy abdominal aorta (AA) and of AAAs with diameters ranging from 45 to 65 mm with (b–d) an early and (e–g) late microstructure. Half of the intraluminal thrombus (ILT) was hidden for each macro-scale model to better represent the stretches in the wall, and only one (of five) exemplary representative volume element (RVE), simulated according to the macro-deformation gradient F, is shown. M and IQR refer to the median and interquartile range, respectively, of the λ1 values for each RVE. The colour scale applies to all models.

