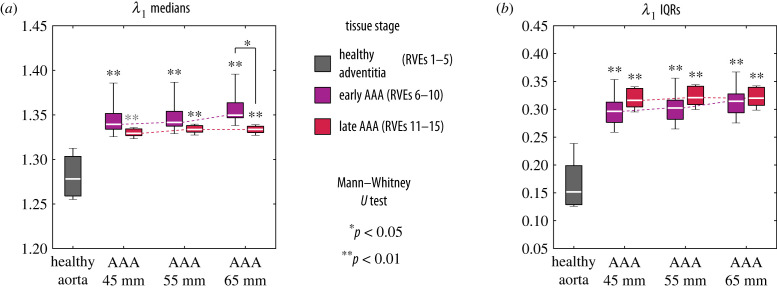
Figure 4.
Boxplots of (a) the median and (b) the interquartile range (IQR) values of the maximum principal stretch λ1 grouped by the three microstructural stages of the tissue and, in case of AAAs, also by maximum diameter. Each of the seven groups contains the results of five representative volume elements (RVEs). For both quantities, the grey asterisks indicate the results of the Mann–Whitney U test for differences between each diseased group and the healthy group. When comparing the AAA stages, the same test showed a significant difference only for λ1 medians of an AAA with a diameter of 65 mm (asterisk).

