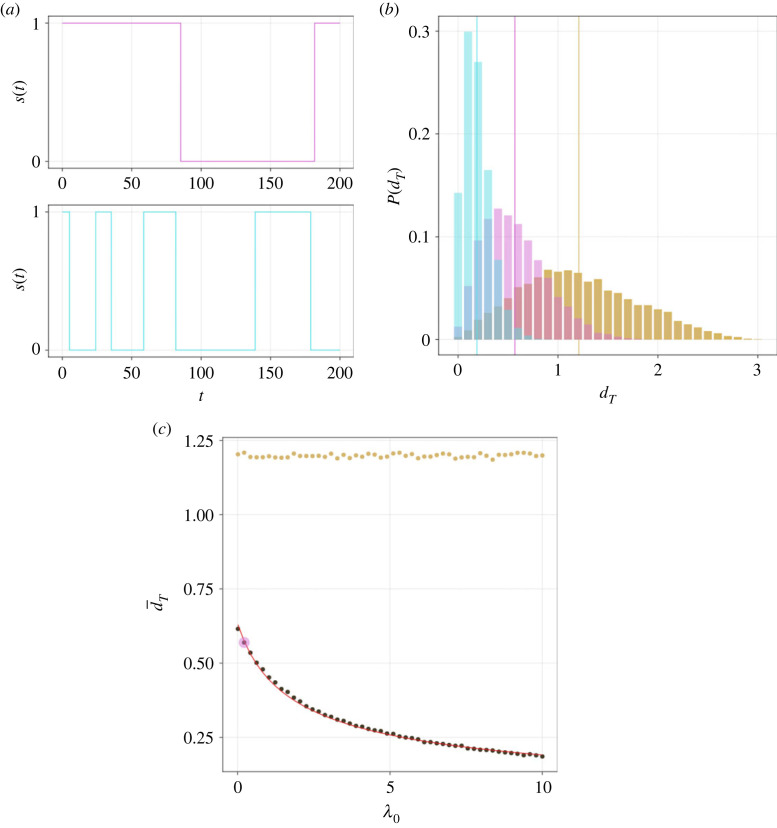
Figure 4.
The effect of timer kinetics on spatial redistribution of the T6SS. (a) Realizations of the state variable, s(t), are plotted against time in the case of small (top, magenta) and large (bottom, cyan) λ0 (0.35 and 9.66, respectively). (b) Empirical PDFs, P, for MC displacement after time T, dT, are plotted for small (magenta) and large (cyan) λ0. Vertical lines denote estimated means. Yellow histogram denotes estimated PDFs in the case where MC positions are uniformly sampled from the spatial domain. (c) The mean displacement after time T, , is plotted against λ0 (red line denotes theoretical model; see equation (2.7)). Coloured markers denote small and large λ0. T = 10. Other parameter values as in table 2 unless otherwise stated.

