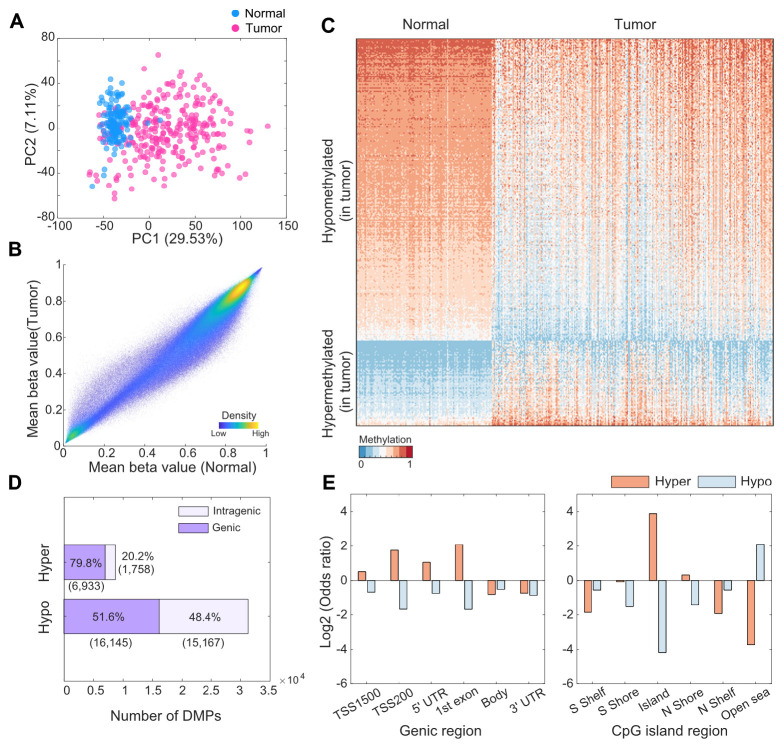
Fig. 2.
Differential methylation patterns between tumor and normal tissues. (A) PC plot based on 616,162 preprocessed probes. (B) Scatter plot of mean beta values between tumor and normal samples. (C) Heatmap of the expression of differentially methylated probes. Probes were randomly selected among 5% of total differentially methylated positions (DMPs) in each hypermethylation and hypomethylation. (D) Total number of DMPs between tumor and normal samples. Purple and light purple represent the DMP of the genic (including the promoter region) and intragenic regions, respectively. The numbers within parentheses represent the number of DMPs. (E) Odds ratios of the number of region-dependent DMPs with the total EPIC array positions. Shore represents the region up to 2 kb upstream (N shore) or downstream (S shore) from the start of the CpG island, and shelf represents the region from 2 to 4 kb upstream (N shelf) or downstream (S shelf) from the start of the CpG island.

