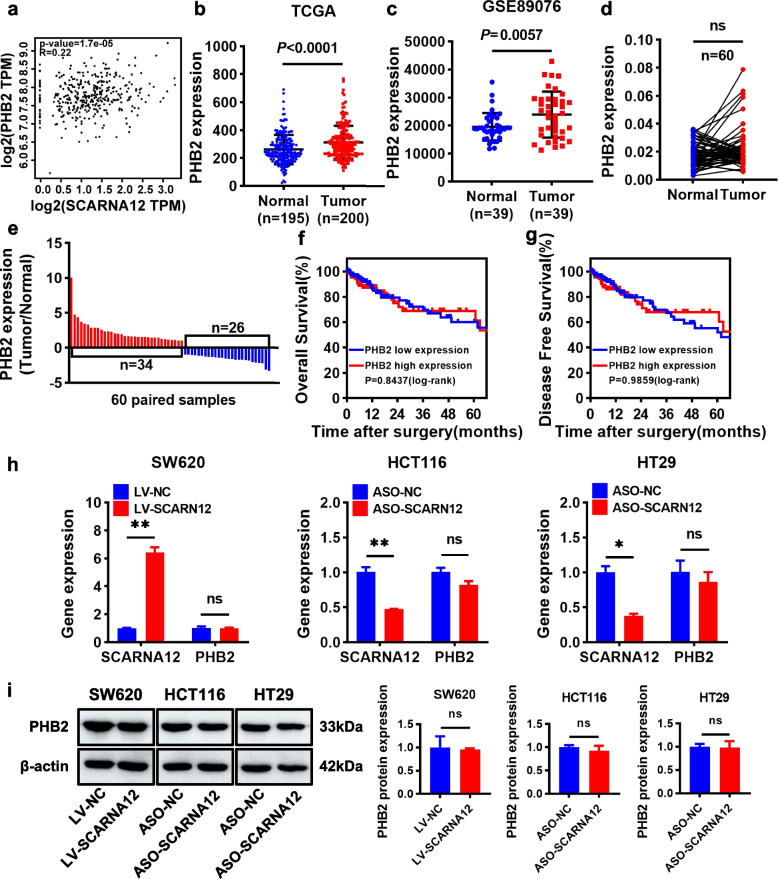
Fig. 4.
SCARNA12 had no effect on host gene PHB2. a The correlation between SCARNA12 and PHB2 in CRC tissues was analyzed from GEPIA website. b-c Relative expression of PHB2 in CRC tissues and normal tissues from TCGA database (normal = 195, tumor = 200) (b), GEO GSE89076 dataset (n = 39, each group) (c). d-e The expression levels of PHB2 in 60 pairs of CRC tissues and matched para-cancer tissues were detected by qRT-PCR (d). Red columns indicate upregulated and the blue represent downregulated in e. f-g Kaplan–Meier analysis with log-rank test assessed the impact of PHB2 expression levels on OS (f) and DFS (g) in CRC patients from the TCGA database (PHB2 low expression = 223, PHB2 high expression = 222). h-i Effect of SCARNA12 on the expression of PHB2 mRNA (h) and protein (i). The results are presented as the mean ± SD (n = 3). ns, no significance; * P < 0.05, ** P < 0.01

