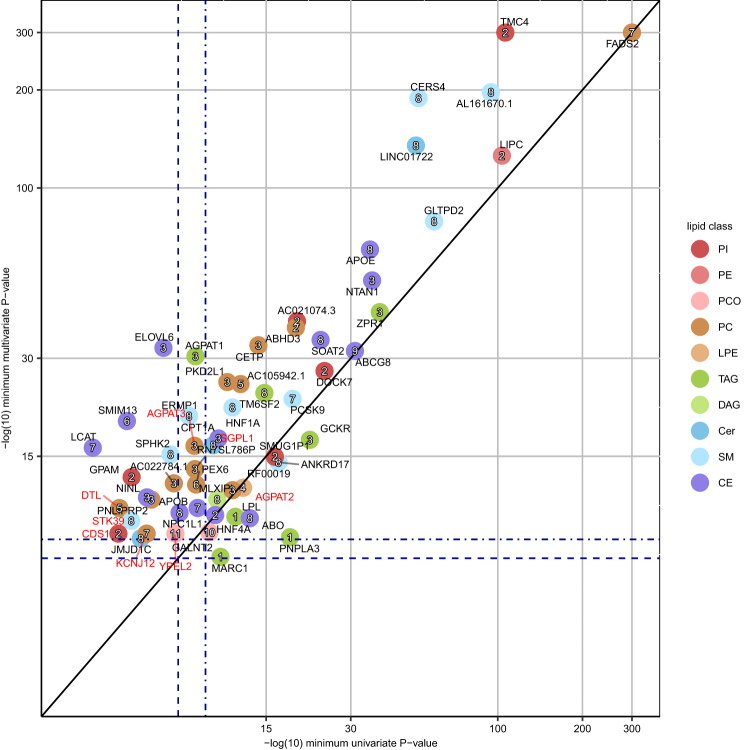
Fig. 3. Comparison of the univariate and multivariate P-values for 56 lipid-associated loci.
The loci are colored by the lipid class from the univariate analysis and labeled by the cluster number from the multivariate analysis. The x-axis shows the P-values of the top associated univariate lead variant of the loci. The y-axis shows the P-values of the top associated multivariate lead variant of the loci. Two-sided P-values were calculated using a linear-mixed-model (uv) and canonical correlation analysis (mv). If no variant reached P < 5e-8 for the locus in univariate analysis, the minimum univariate P-value of the lead variant of the multivariate analysis is shown. Known loci and novel loci are annotated by the locus name in black and red, respectively. Dark blue dashed lines represent the genome-wide significance level (P < 5e-8) and dark blue dot-dashed lines represent the multiple testing-corrected significance level (uv: 7.352941e-10, mv: 4.545455e-9). Black line shows the diagonal. The lipid class names are listed in Fig. 1. The axes are capped at 300.

