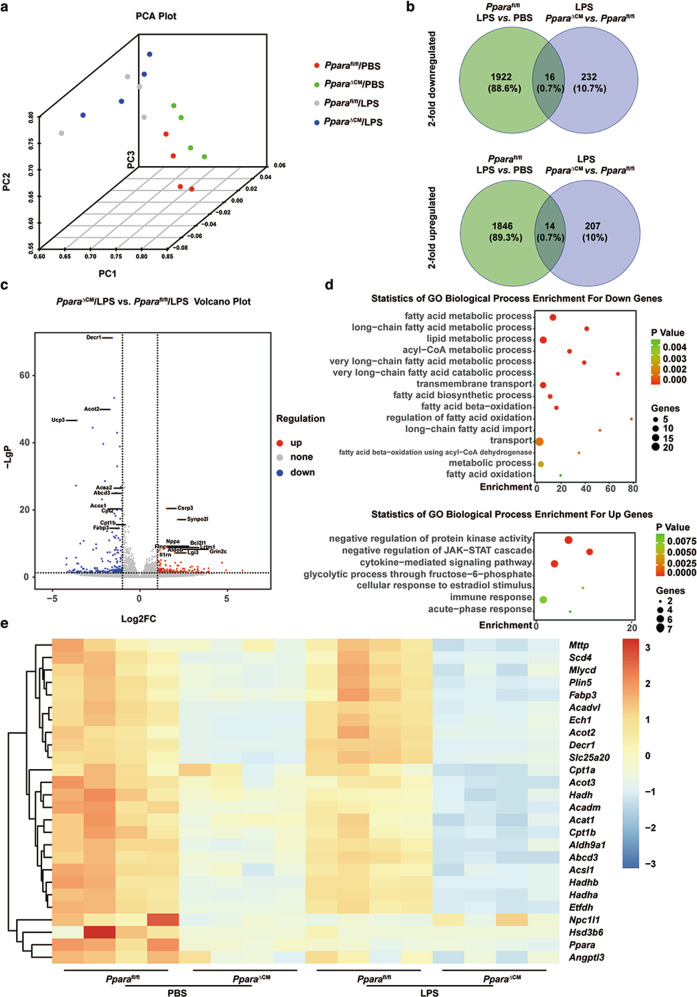
Fig. 5. Cardiomyocytes-specific Ppara disruption potentiates LPS-induced fatty acid metabolism dysfunction.
Pparafl/fl and PparaΔCM mice were administered PBS or LPS (5 mg/kg) for 12 h. a PCA performed using DESeq2 rlog-normalized RNA-seq data. Loadings for principal components (PC) 1, PC2 and PC3 are shown in graph on x-, y- and z-axis. b Venn diagrams showing the number of twofold upregulated (top panel) and two-fold downregulated (bottom panel) genes and their overlap in hearts of Pparafl/fl and PparaΔCM mice after PBS or LPS treatment. c Volcano Plot showing the upregulated and downregulated genes in heart tissue from PparaΔCM mice compared with Pparafl/fl mice after LPS treatment. d Selected enrichment of GO term analysis of upregulated or downregulated genes in hearts of LPS-treated PparaΔCM mice compared with Pparafl/fl mice. e Heatmap of normalized expression values of genes involved in fatty acid metabolism in hearts of Pparafl/fl and PparaΔCM mice after PBS or LPS treatment.

