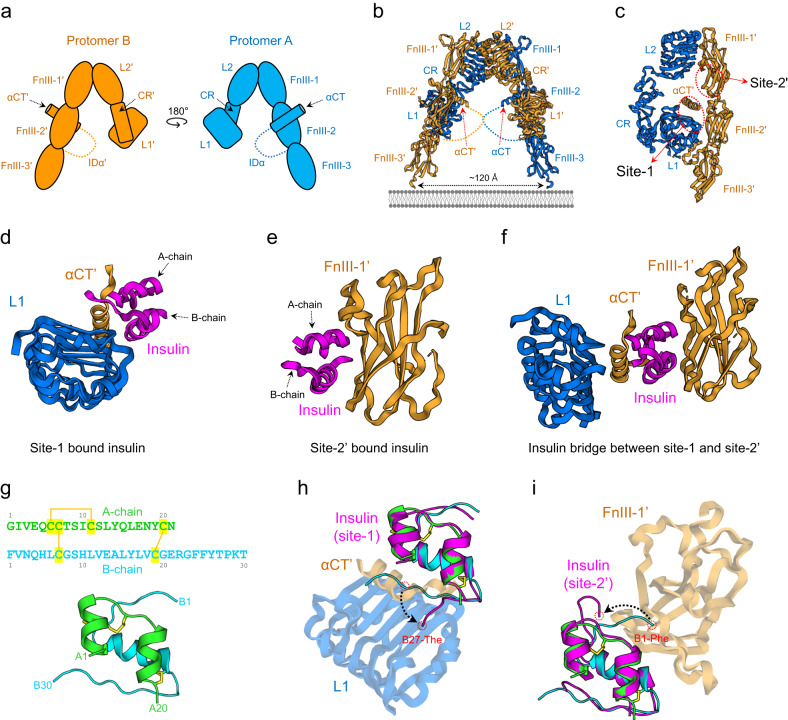
Fig. 2. Inactive conformation and two insulin binding sites of IR.
a Schematic diagram of IR based on the apo (unliganded) structure. Protomer A and B are colored blue and orange, respectively. b The X-ray crystal structure of apo IR (PDB ID: 4ZXB). Two hook-like protomers form a symmetric Λ-shaped dimer in an antiparallel manner. c Orthogonal view of one-half of the Λ-shaped IR homodimer. Two insulin binding sites, site-1 and site-2’, are shown in red dotted circles. d Close-up view of insulin-bound site-1 in the Γ-shaped IR structure (PDB ID: 7YQ3). e Close-up view of insulin-bound site-2’ in the T-shaped IR (PDB: 6PXV). f Close-up view of the insulin bridge between site-1 and site-2’ in the two-insulin-bound tilted T-shaped structure (PDB ID: 7STK). g Amino acid sequence and structure (PDB ID: 1MSO) of human insulin. The A-chain and B-chain are colored green and cyan, respectively. Yellow lines indicate disulfide bonds. h Superimposition of free insulin (PDB ID: 1MSO; green and cyan) and insulin-bound site-1 (PDB ID: 6VEP; pink). i Superimposition of free insulin (PDB ID: 1MSO; green and cyan) and insulin-bound site-2’ (PDB ID: 6SOF; pink).

