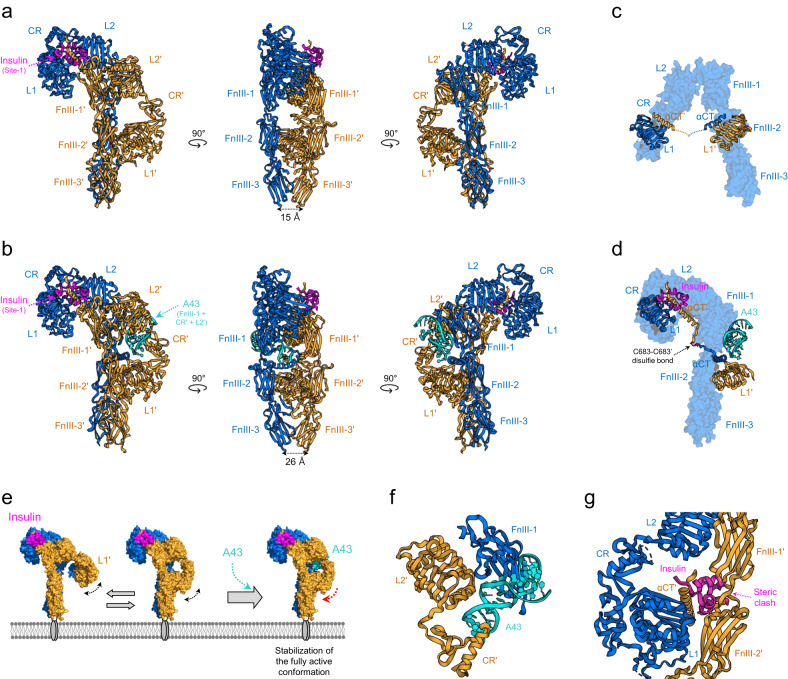
Fig. 3. Fully active Г-shaped IR bound to a single insulin molecule.
a Cryo-EM structure of the IR extracellular region with the leucine-zipper domain fused to the C-terminus (6HN5 and 6HN4). b Cryo-EM structure of full-length IR bound to one insulin molecule and one A43 aptamer (PDB ID: 7YQ3). The A43 aptamer fits in a pocket comprising FnIII-1, CR′, and L2′ on the insulin-free side. c Close-up view of αCT and αCT′ interacting with L1’ and L1, respectively, in the apo IR structure (PDB ID: 4ZXB). The crosslink between insert domains is missing in the structure. d Close-up view of the αCT-αCT′ bridge cross-linked by the C683-C683’ disulfide bond in the A43-bound Γ-shaped IR structure. e A model for the insulin-enhancing activity of the A43 aptamer. When a single insulin molecule binds to IR leads to the Γ-shaped conformation, the position of the opposite L1’ may become unstable. Because of the αCT-αCT′ bridge, the structural instability of L1’ can interfere with insulin binding to site-1 (L1’ and αCT′) by increasing steric tension between L1 and L1′. A43 binding to IR can stabilize the Γ-shaped conformation by fixing the position of L1’, which enhances insulin-induced IR phosphorylation by stabilizing insulin binding to site-1. f Close-up view of A43 in a pocket comprising FnIII-1, CR′, and L2′ in Fig. 3b. g Superposition of insulin bound to site-1 in the Γ-shaped IR structure onto the Λ-shaped apo IR by aligning the L1 domain to demonstrate the steric clash of insulin. Steric clash of insulin (pink) with FnIII-1’ and FnIII-2’ (orange) is evident.

