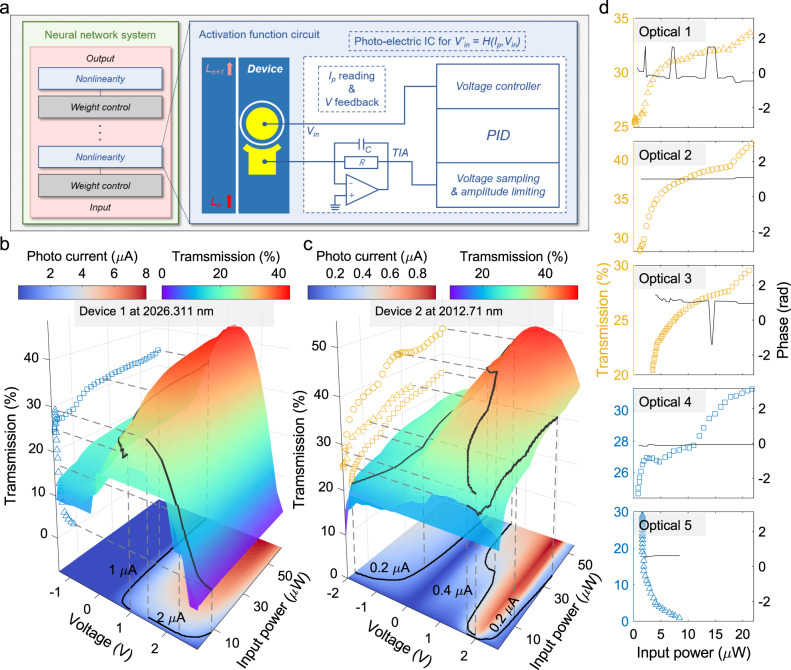
Fig. 4. Generation mechanism and results of optical activation fucntions.
a Block diagram of photonic neural network integrated with our activation function devices. b, c Photocurrent and transmission versus bias voltage and input power of device 1 and device 2, respectively. Black dashed lines in the filled contours of photo current represent the current contours to generate activation functions. Black solid lines in the transmission surface are the corresponding transmission mapped from the photocurrent contours. The scattering plots are data points of the extracted activation functions. d Five activation functions with transmission and phase shift information deduced from device 1 and device 2 corresponding to different photocurrent contours.

