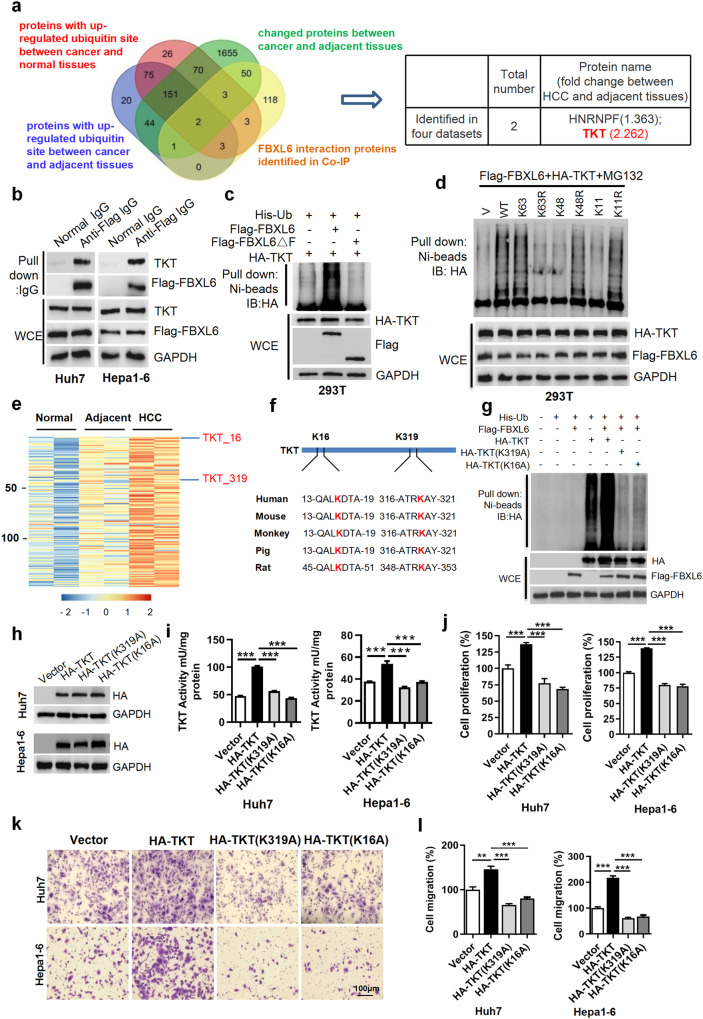
Fig. 2. FBXL6 triggers K63-linked TKT ubiquitination at K16 and K319, leading to TKT activation and HCC metastasis.
a Diagram showing the number of proteins with an expression fold change of more than 1.2 between cancer and adjacent tissues (green), proteins with increased ubiquitin sites (a cutoff of a ≥ 1.5-fold change; blue/red), and proteins binding to FBXL6 (yellow) in HCC tumors. b FBXL6 bound to endogenous TKT. Human Huh7 and mouse Hepa1-6 cells were transfected with Flag-FBXL6 plasmids for 48 h and were then lysed. The indicated antibodies and Protein A/G PLUS-Agarose were added to the cell lysates. c HEK293T cells were cotransfected with the Flag-FBXL6ΔF (deletion of F-box domain), Flag-FBXL6, or HA-TKT plasmid and the ubiquitin plasmid for 45 h and were then exposed to MG132 (10 µM) for 3 h to block protein degradation. Cells were lysed in RIPA buffer, followed by pulldown using Ni-NTA beads or direct immunoblotting (IB) with the indicated antibodies. d HEK293T cells were cotransfected with the Flag-FBXL6 and HA-TKT plasmids and the indicated ubiquitin plasmids, followed by pulldown using Ni-NTA beads or direct IB with the indicated antibodies. K63, K48, and K11, indicating Lys residues in ubiquitin, were individually mutated to Arg. e Heatmap showing the 147 proteins with increased ubiquitination in HCC tissues compared to adjacent tissues and in adjacent tissues compared to normal tissues. f Examination of the TKT protein sequence identified K319 and K16 in TKT as evolutionarily conserved in different species. g HEK293T cells were cotransfected with the Flag-FBXL6 plasmid and the wild-type TKT or a TKT mutant plasmid for 45 h and were then treated with MG132 (10 µM) for 3 h to block protein degradation. Cells were lysed in RIPA buffer, followed by pulldown using Ni-NTA beads or direct Western blotting with the indicated antibodies. h–l Huh7 or Hepa1-6 cells were transfected with HA-TKT, HA-TKT (K319A), or HA-TKT (K16A) for 48 h. A portion of the cells was harvested for Western blotting (h) or detection of TKT activity using a TKT-specific activity assay kit (i). Another portion was used for a cell proliferation assay (j). Other portions were reseeded into Transwell plates for a migration assay (k, l). Data are representative of three independent experiments. Scale bar, 100 μm. One-way ANOVA with Tukey’s multiple comparisons test was used. n = 3–4, biological replicates. **p ≤ 0.01, ***p ≤ 0.001.

