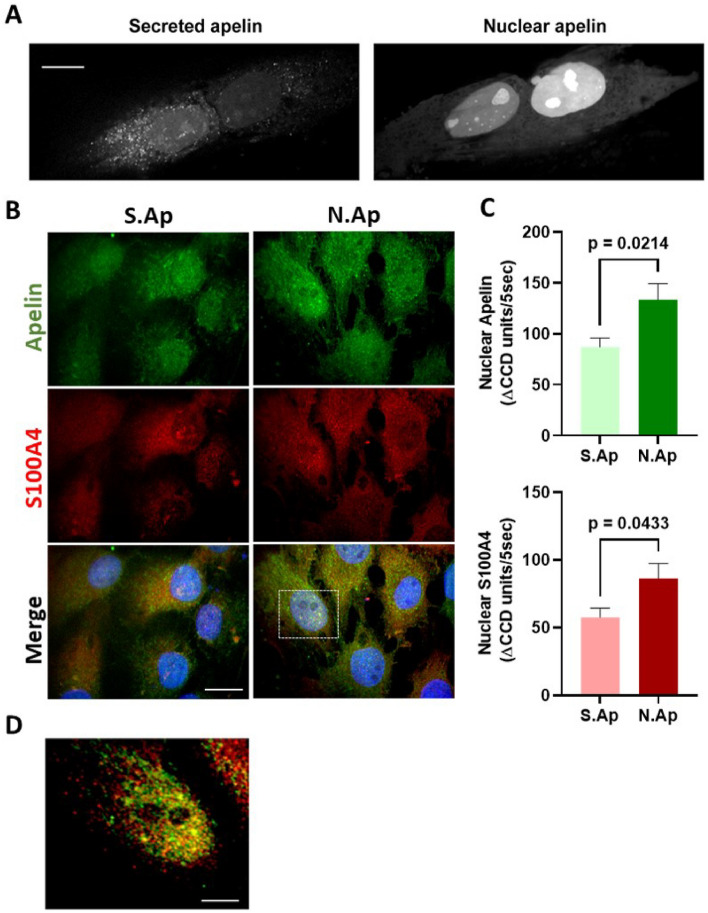
Figure 2.
Overexpression of apelin plasmids and colocalization with S100A4 in SMCs. (A) Expression of mutated apelin/eGFP constructs is observed by live imaging of SMCs: Scale bar = 10 μm. Representative confocal microscopy staining (B) and nuclear quantification (C) of apelin and S100A4 expression in S-SMCs 96 h after transfection with S.Ap (n = 23 nuclei) or N. Ap (n = 29 nuclei)-encoded plasmids. Nuclei are stained in blue with DAPI. Scale bar = 10 μm. (D) 2.5 × magnified region highlighted by the dashed square in (B) and showing apelin and S100A4 expression in the nucleus. Scale bar = 4 μm.

