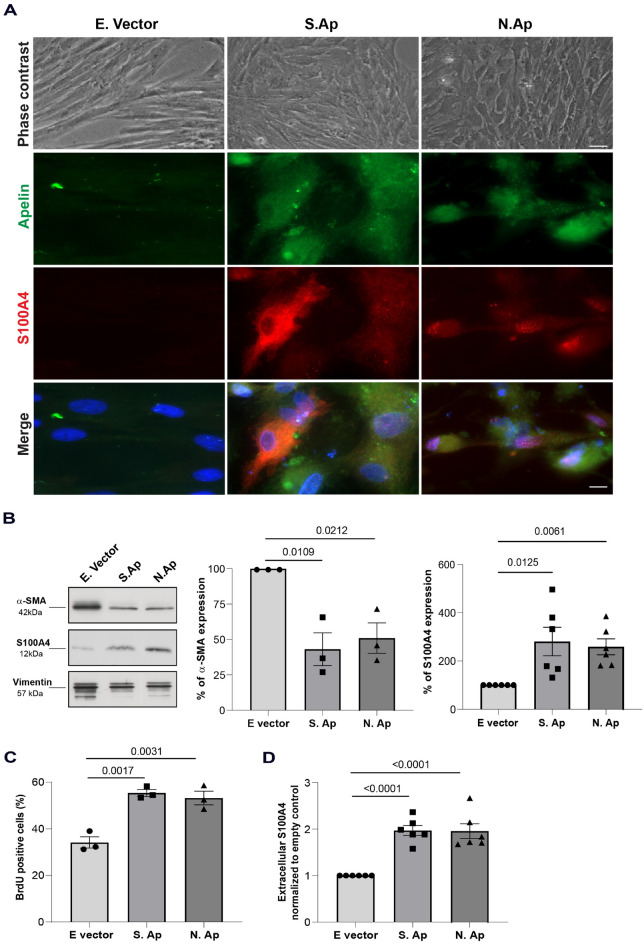
Figure 3.
Effect of S. Ap and N. Ap overexpression in SMC phenotypic transition. (A) Representative phase-contrast photomicrographs (scale bar = 20 μm) and double immunofluorescence staining (scale bar = 10 μm) showing apelin and S100A4 expression in empty vector-transfected, S. Ap-transfected and N. Ap-transfected S-SMCs. (B) Representative immunoblot (cropped images showing important bands only) and bar graph showing α-SMA and S100A4 expression (n = 3 and n = 6, respectively) normalized to empty vector in transfected S-SMCs 96 h after transfection with empty vector (dots), S. Ap (squares), and N. Ap (triangles), original blots are presented in pages 7–9 of the supplementary file. (C) Bar graph showing the percentage of BrdU-positive S-SMCs, 96 h after transfection with empty vector (dots), S. Ap (squares), and N. Ap (triangles, n = 3). (D) Bar graph showing extracellular S100A4 levels detected by competitive ELISA assay in S-SMC supernatants after transfection with empty vector (dots), S. Ap (squares), and N. Ap (triangles, n = 6).

