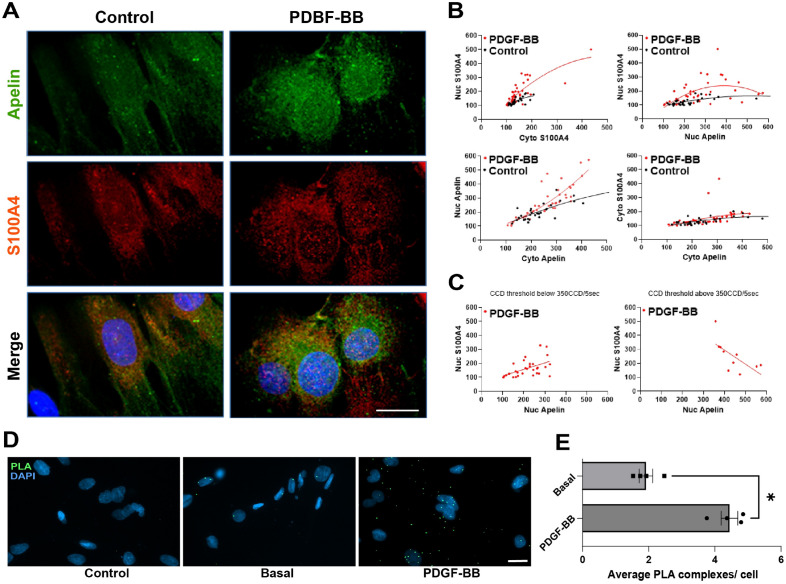
Figure 4.
PDGF-BB mediated SMC phenotypic switch induces interaction and nuclear expression of apelin and S100A4. (A) Double immunofluorescence staining showing apelin, S100A4, and both in S-SMCs after treatment with PDGF-BB for 96 h (n = 4). Nuclei are stained in blue with DAPI. Scale bar = 10 μm. (B) Graphs showing quantification of nuclear versus cytoplasmic apelin and S100A4 in S-SMCs treated with PDGF-BB vs control. Black and red lines were generated from a second order polynomial non-linear fit regression. (C) Data were separately displayed for a threshold value below or above 350 CCD units/5 s, and were analysed by simple linear regression and Pearson’s correlation. (D) Representative images of apelin and S100A4 interaction detected by in situ proximity ligation assay (PLA) in non-stimulated (Basal) and PDGF-BB stimulated SMCs (PDGF-BB). The control condition represents the absence of one of the primary antibodies (here the rabbit anti-apelin, Control). Scale bar, 20 μm. (E) Statistical analysis of average PLA complexes per cell (n = 4), Mann–Whitney non-parametric test, *p = 0.0286.

