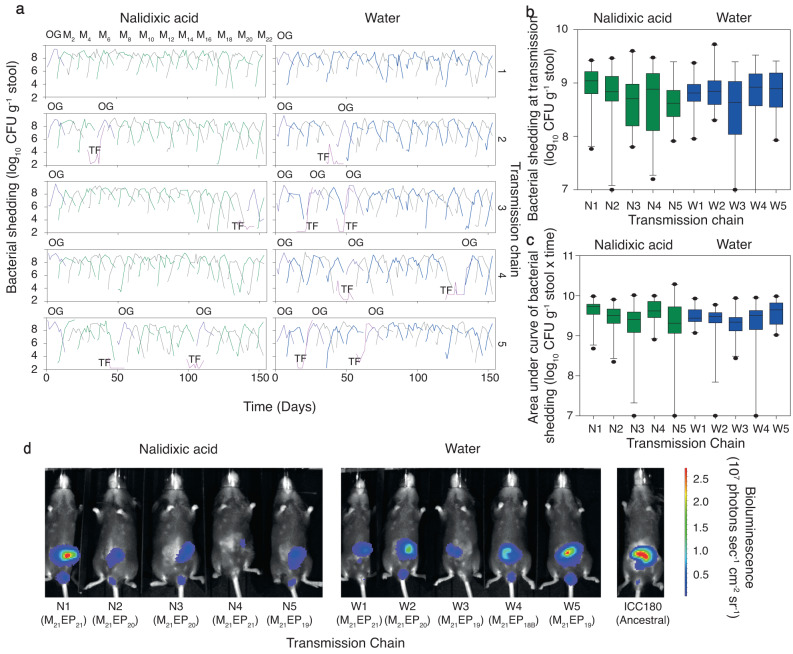
Fig. 2. In vivo infection and transmission dynamics of 10 mouse-to-mouse Citrobacter rodentium ICC180 transmission chains.
a Bacterial shedding in stool of each animal (as colony forming units [CFU] g−1 stool over 14 days) with alternating colours for each subsequent transmission event (green and grey for animals in the nalidixic acid treated transmission chains; blue and grey for animals in the water transmission chains). Animals infected by oral gavage (OG) are shown in purple, while those who failed to be infected by natural transmission (TF, transmission failure) are shown in pink. b Box plot of bacterial shedding (as CFU g-1 stool) at transmission summarised by transmission chain (n = 19-21 biologically independent mice per chain). Box plot indicates median (middle line), 25th and 75th percentile (box), 5th and 95th percentile (whiskers) as well as outliers (single points); green boxes are from nalidixic acid treated transmission chains and blue boxes are from water transmission chains. c Box plot of the area under curve values of bacterial shedding (as CFU g−1 stool × time) by transmission chain (n = 20 biologically independent mice per chain). Box plot indicates median (middle line), 25th and 75th percentile (box), 5th and 95th percentile (whiskers) as well as outliers (single points); green boxes are from nalidixic acid treated transmission chains and blue boxes are from water transmission chains. d In vivo location of C. rodentium ICC180 within donor mice (M21) at the time of transmission compared to ancestral ICC180. EP, effective passage. Source data are provided as a Source Data file.

