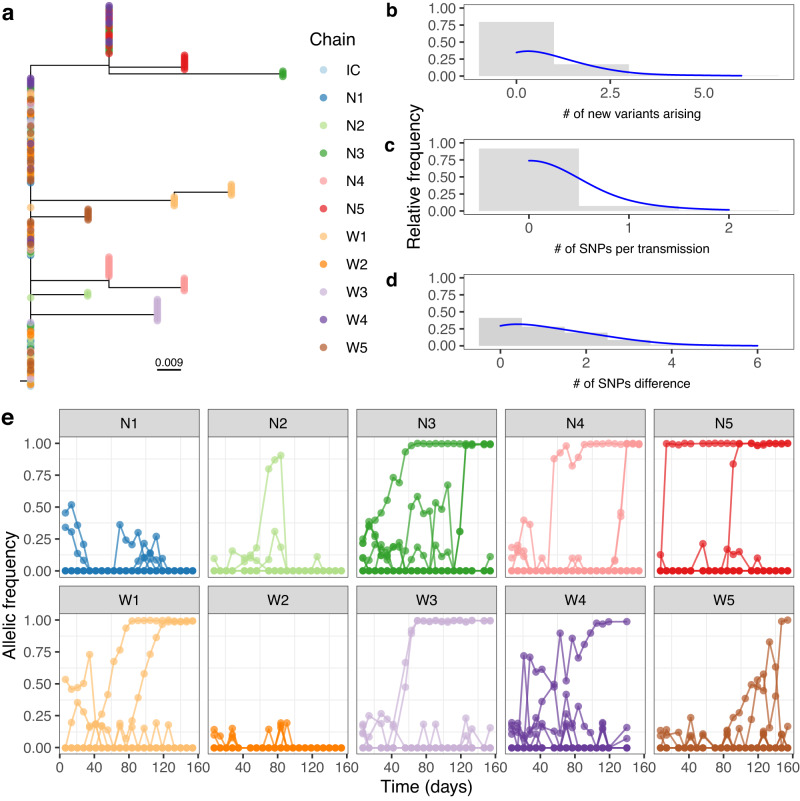
Fig. 3. Accumulation of diversity along transmission chains.
a Maximum likelihood phylogenetic tree based on core SNPs with tips annotated by transmission chain. The “IC” chain refers to the reference ICC180, which was used as an outgroup to root the tree. b–d Histograms showing the relative frequency for the number of iSNVs emerging in a transmission step, the number of SNVs becoming fixed during transmission, and the SNP distances across the full dataset, respectively. e Line graph tracking the allelic frequency of each locus throughout the ten transmission chains. Source data are provided as a Source Data file.

