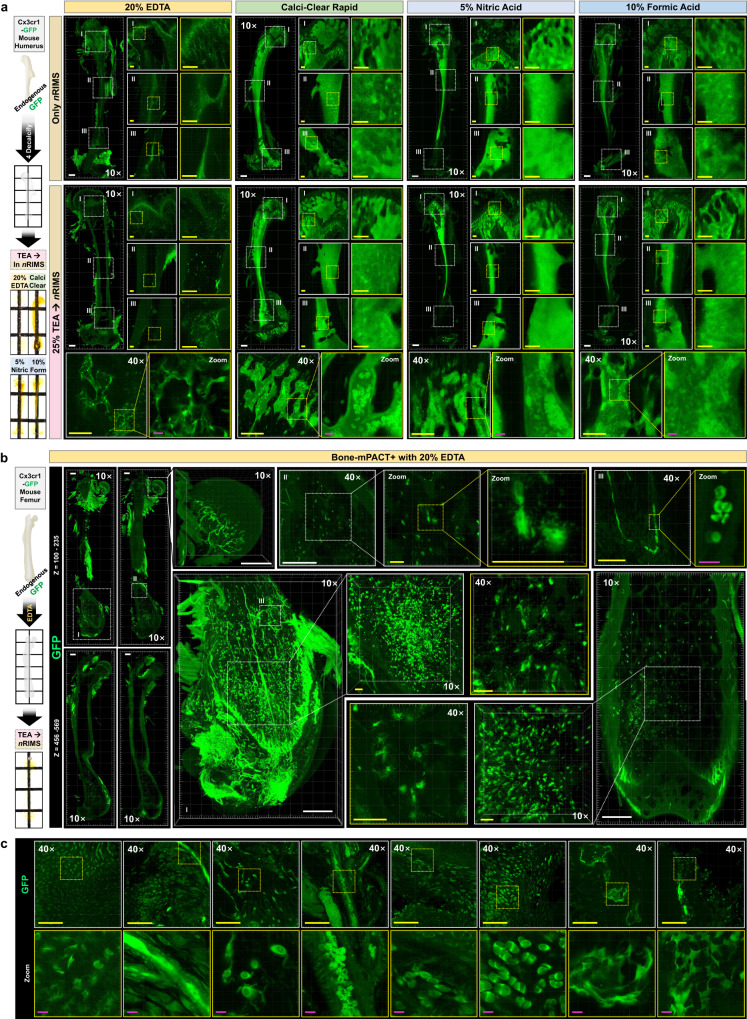
Fig. 6. Comparison of Cx3cr1-GFP mouse bone imaging using Bone-mPACT + .
a Comparison of GFP (green) expression patterns in Cx3cr1-GFP mouse humerus samples processed using Bone-mPACT+ with four decalcification solutions: 20% EDTA (3 × 8 tiled, range: 120–133 μm), Calci-Clear Rapid (3 × 8 tiled, range: 131–137 μm), 5% nitric acid (3 × 8 tiled, range: 134–142 μm), and 10% formic acid (3 × 8 tiled, range: 118–122 μm). Comparison of upper images (directly incubated in nRIMS after clearing) and lower images (incubated in 25% TEA and then nRIMS after clearing). b The GFP expression pattern in Cx3cr1-GFP mouse femur samples processed using Bone-mPACT+ with 20% EDTA. (left) The upper (z = 110–235 μm) and lower (z = 456–569 μm) images of mouse femurs were 3 × 11 tiled. A 3D projection of endogenous fluorescence (GFP) expression focusing on the distal epiphysis (2 × 3 tiled, range: 353 μm) and femoral head (2 × 2 tiled, range: 555 μm), including the bone marrow (1 × 1 tiled, range: 30 μm). c The morphology of GFP expressing cells in Cx3cr1-GFP mouse femurs processed using Bone-mPACT+ with 20% EDTA. All images were acquired with a 10× and 40× objective on a confocal laser microscope. Scale bar (white: 500 μm, yellow: 100 μm, magenta: 10 μm).

