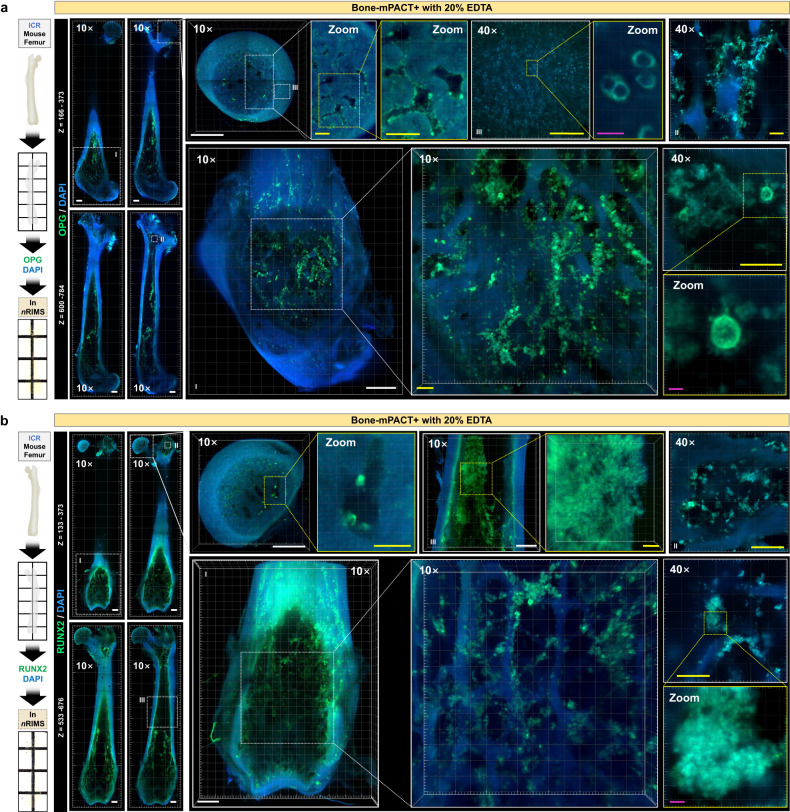
Fig. 7. Imaging analysis of mouse bone using Bone-mPACT+.
a OPG (green) and DAPI (blue) immunostaining in ICR mouse femur samples processed using Bone-mPACT+ plus 20% EDTA. (left) The upper (z = 166–235 μm) and lower (z = 456–784 μm) images of the mouse femur samples were 3 × 11 tiled. A 3D projection of OPG (green) expression, focusing on the distal epiphysis (3 × 3 tiled, range: 200 μm) and femoral head (2 × 2 tiled, range: 360 μm), including the bone marrow (1 × 1 tiled, range: 180 μm). b RUNX2 (green) and DAPI (blue) immunostaining in ICR mouse femur samples processed using Bone-mPACT+ plus 20% EDTA. Whole images (3 × 11 tiled, range: 133–676 μm) of RUNX2 (green) and DAPI (blue) expression in mouse femur bone. A 3D projection of RUNX2 (green) expression focusing on the distal epiphysis (3 × 4 tiled, range: 527 μm) and femoral head (2 × 2 tiled, range: 243 μm), including the bone marrow in the upper (2 × 2 tiled, range: 237 μm) and lower (1 × 1 tiled, range: 208 μm) images. All images were acquired with 10× and 40× objectives on a confocal laser microscope. Scale bar (white: 500 μm, yellow: 100 μm, magenta: 10 μm).

