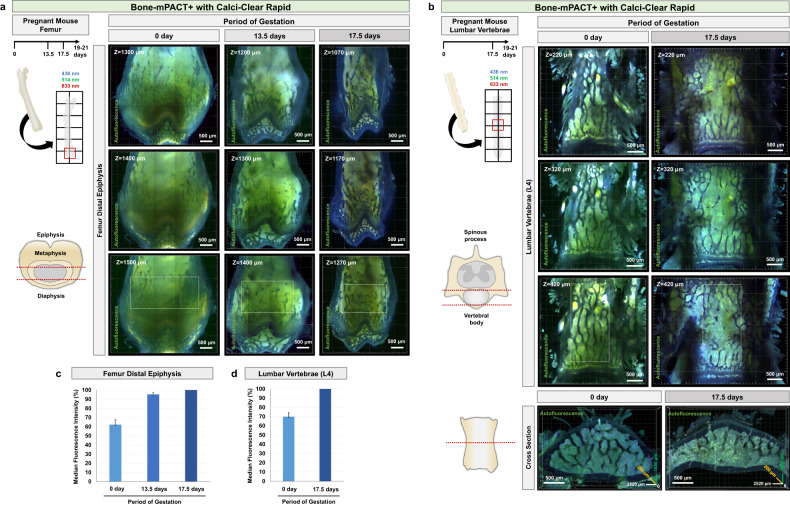
Fig. 8. Visualization of bone marrow pattern in female mouse bones during pregnancy using Bone-mPACT+ with Calci-Clear Rapid.
Comparison of endogenous fluorescence images of transparent maternal mouse femur bones (a) and fourth lumbar vertebrae (L4) (b) processed using Bone-mPACT+ with Calci-Clear Rapid. Single z-stack images of bones at (left) 0, (middle) 13.5, and (right) 17.5 gestational days (full gestation = 21 days). Scale bar (white: 500 μm). c, d Relative fluorescence intensity (bone marrow) in images of mouse femur distal epiphysis (each n = 5; imaging depth: 1200–1500 µm) (a) and mouse lumbar vertebra samples (each n = 5; imaging depth: 400–500 µm) (b). Merged images showing autofluorescence in three channels; green (wavelength: 514 nm), red (wavelength: 633 nm), and blue (wavelength: 436 nm). Each colored line indicates the values for the three distinct assessment periods. The results are the averages of five separate tests.

