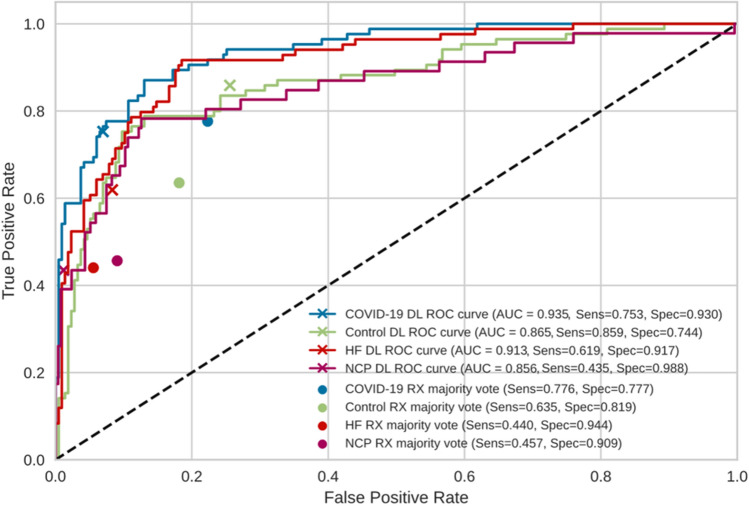
Figure 5.
Comparison of the performance of MultiCOVID model with consensus expert radiologist interpretations on random sample of 300 images from the test set. The receiver operating characteristic (ROC) curves for each category (COVID-19 – blue; Control – green; Heart Failure (HF) – red and Non-COVID Pneumonia (NCP) – magenta) are shown for MultiCOVID (DL) and for the consensus interpretation of radiologists (majority vote). Sensitivity (Sens) and specificity (Spec) are also plotted for each category assessed. DL: deep learning.

