. 2023 Aug 16;29(21):4492–4503. doi: 10.1158/1078-0432.CCR-23-0290

Figure 4.

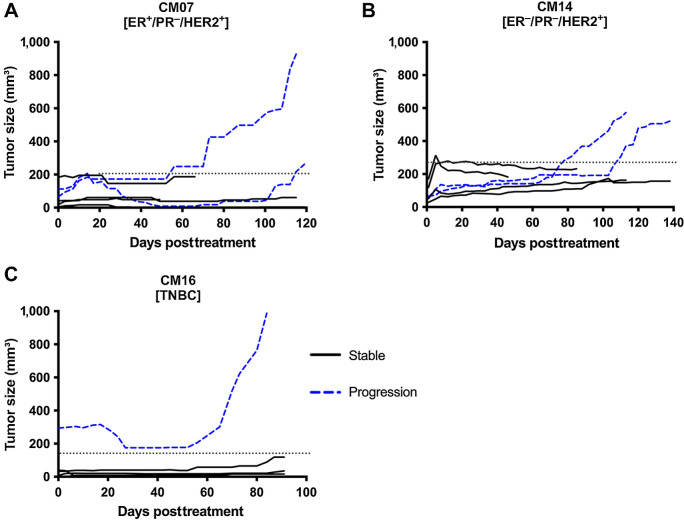
Figure 4. Growth curves of PDX tumors that were stable or progressed. A–C, Growth curve of individual tumors in the AZD1390 and radiation combination group. Solid lines represent tumors that were stable and did not grow after treatment, while blue dashed lines represent tumors that grew back and progressed. Dotted line indicates threshold used to determine stable and progression tumors for each PDX model.

Growth curves of PDX tumors that were stable or progressed. AC, Growth curve of individual tumors in the AZD1390 and radiation combination group. Solid lines represent tumors that were stable and did not grow after treatment, while blue dashed lines represent tumors that grew back and progressed. Dotted line indicates threshold used to determine stable and progression tumors for each PDX model.