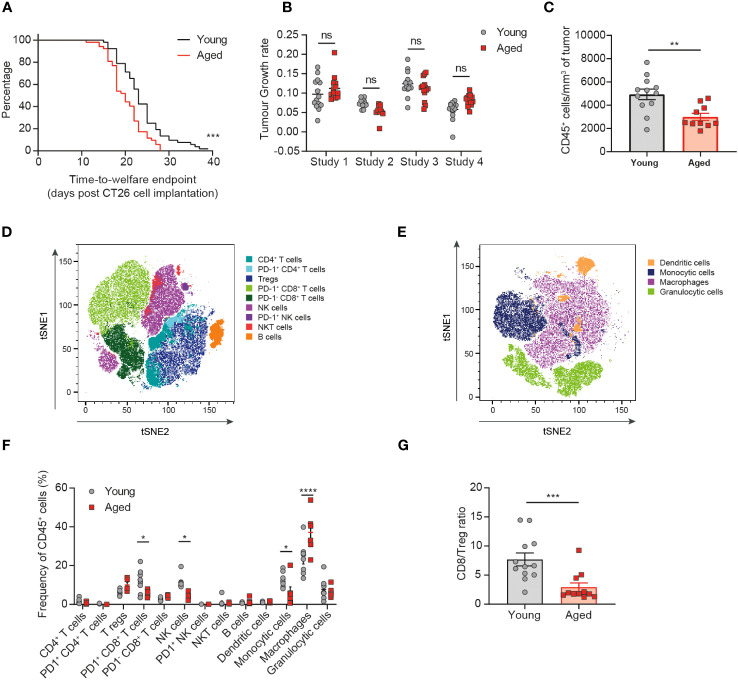
Figure 2.
The tumor immune infiltrate is significantly altered in aged mice. CT26 tumor cells were subcutaneously implanted on the flank of female BALB/c mice either at 6-8 weeks old (young) or at 60-72 weeks old (aged). (A) Kaplan-Meier curves of pooled data from 4 independent experiments showing time-to-welfare endpoint of young and aged mice. 52 mice per group. (B) Rate of tumor growth for each animal across 4 experiments. 10-14 mice per group. (C-G) Flow cytometric analysis of the tumor immune infiltrate 15-17 days after tumor implantation. (C) Absolute cell count per mm3 of tumor of CD45+ immune cells in aged and young mice. 10-12 mice per group. (D, E) tSNE plot showing clusters of lymphoid (D) and myeloid (E) cell types identified by unsupervised clustering analysis. (F) Comparison of the proportion of immune cell clusters within the tumor of young and aged mice. 5-8 mice per group. (G) Comparison of the ratio of CD8+ T cells to Tregs in the tumor of young and aged mice. 11-12 mice per group. The results in panels (A, B) include data from 4 experiments, the results in panels (C, G) include data from 2 experiments, the results in panels (D-F) include data from 1 representative of 2 experiments. ns, non-significant, *P < 0.05, **P < 0.01, ***P < 0.001 and ****P < 0.0001.

