. 2023 Sep 11;4(6):452–467. doi: 10.1158/2643-3230.BCD-23-0014

Figure 4.

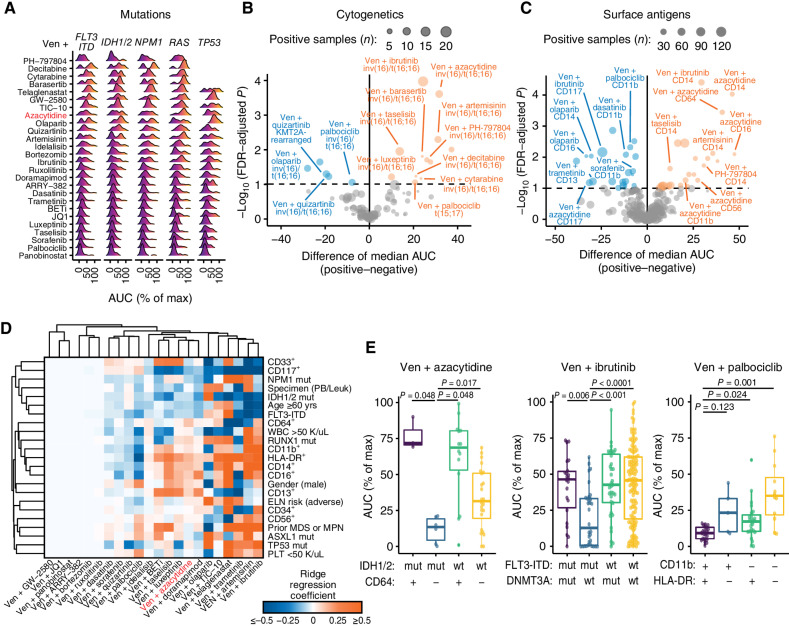
Figure 4. Clinical and genetic features map to associations with combination sensitivity. A, Ridge density plots of venetoclax (Ven) combination sensitivity differences with respect to indicated gene mutations. Color gradients indicate AUC-based ex vivo sensitivity (dark blue/purple) through resistance (orange/yellow). Max, maximum. B and C, Volcano plots showing a comparison of Ven combination sensitivity differences with respect to recurrent cytogenetic rearrangements (B) and immunophenotype surface markers (C). Negative and positive tails of each plot correspond to significantly increased (blue) and decreased sensitivity (orange), respectively, in samples positive for the tested feature. Size of each point represents the number of samples in the comparison that were positive for the tested feature for the given combination. The difference in median AUC was computed by the Hodges–Lehmann; P values were determined by Mann–Whitney tests and corrected for false discovery using the Benjamini–Hochberg method. D, Clustered heat map of multivariate ridge regression coefficient estimates for clinical and genetic feature associations with ex vivo combination sensitivity among newly diagnosed AML patient specimens. Blue and orange shading corresponds to associations of the indicated feature with sensitivity and resistance, respectively, for the corresponding combination. Feature panels and combinations included reflect limitations involving sample numbers and model requirements for minimizing missing data for analysis. E, Bivariate subgroup stratification of ex vivo sensitivity for select Ven combinations for indicated features. Combination AUC was compared across subgroups by the Kruskal–Wallis test; post-hoc pairwise Mann–Whitney tests were performed, with FWER-adjusted P values shown. Abbreviations: mut, mutated; wt, wild-type.

Clinical and genetic features map to associations with combination sensitivity. A, Ridge density plots of venetoclax (Ven) combination sensitivity differences with respect to indicated gene mutations. Color gradients indicate AUC-based ex vivo sensitivity (dark blue/purple) through resistance (orange/yellow). Max, maximum. B and C, Volcano plots showing a comparison of Ven combination sensitivity differences with respect to recurrent cytogenetic rearrangements (B) and immunophenotype surface markers (C). Negative and positive tails of each plot correspond to significantly increased (blue) and decreased sensitivity (orange), respectively, in samples positive for the tested feature. Size of each point represents the number of samples in the comparison that were positive for the tested feature for the given combination. The difference in median AUC was computed by the Hodges–Lehmann; P values were determined by Mann–Whitney tests and corrected for false discovery using the Benjamini–Hochberg method. D, Clustered heat map of multivariate ridge regression coefficient estimates for clinical and genetic feature associations with ex vivo combination sensitivity among newly diagnosed AML patient specimens. Blue and orange shading corresponds to associations of the indicated feature with sensitivity and resistance, respectively, for the corresponding combination. Feature panels and combinations included reflect limitations involving sample numbers and model requirements for minimizing missing data for analysis. E, Bivariate subgroup stratification of ex vivo sensitivity for select Ven combinations for indicated features. Combination AUC was compared across subgroups by the Kruskal–Wallis test; post-hoc pairwise Mann–Whitney tests were performed, with FWER-adjusted P values shown. Abbreviations: mut, mutated; wt, wild-type.