. 2023 Sep 11;4(6):452–467. doi: 10.1158/2643-3230.BCD-23-0014

Figure 6.

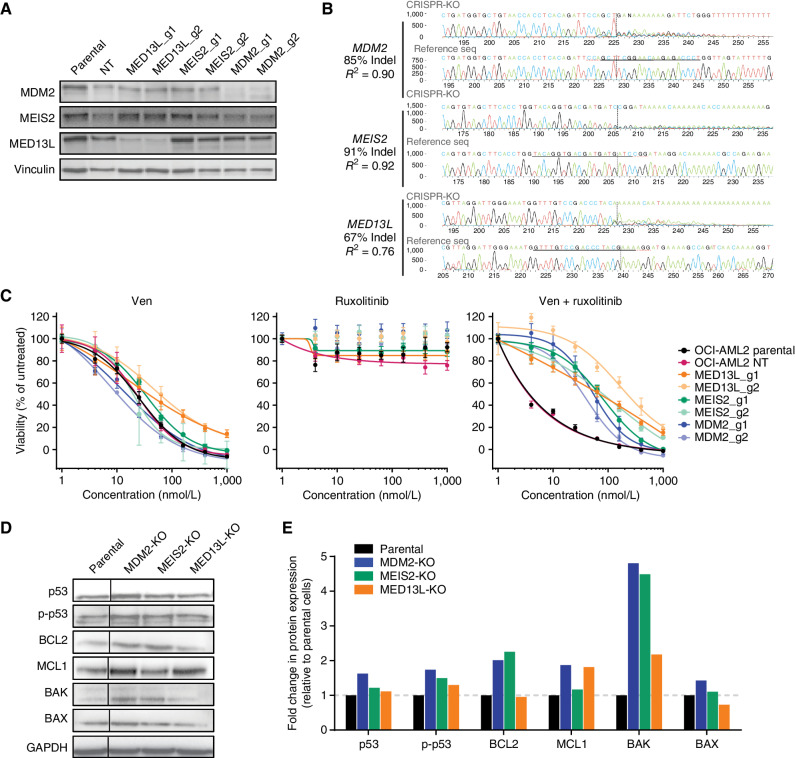
Figure 6. Validation of CRISPR screen hits for resistance to the Ven + ruxolitinib combination. A, Immunoblot analysis of OCI-AML2 cells transduced with two independent guide RNAs for genes identified in the Ven + ruxoltinib CRISPR/Cas9 resistance screen. Cells were lysed, subjected to SDS-PAGE, transferred to PVDF membranes, and probed for levels of MED13L, MDM2, and MEIS2; vinculin was used as a protein loading control. Parental denotes untransduced OCI-AML2 cells; NT, nontargeting control guide. B, TIDE sequencing comparisons of genomic loci for MED13L, MDM2, and MEIS2 relative to parental OCI-AML2 controls following transduction and CRISPR modification. C, Dose-response curves for OCI-AML2 cells transduced as in B with two independent guide RNAs for MED13L, MDM2, and MEIS2 and tested for sensitivity to Ven, ruxolitinib, and Ven + ruxolitinib. Data points represent the mean normalized cell viability ± SEM for three replicates. Parental denotes untransduced OCI-AML2 cells; NT, nontargeting control guide. D, Immunoblot analysis of indicated proteins in OCI-AML2 parental and CRISPR knockout (KO) lines for MED13L, MDM2, or MEIS2. The vertical line denotes the cropping of nonadjacent lanes to juxtapose samples for ease of comparison. E, Quantification by densitometry of protein levels detected by immunoblot analysis in D. Band intensities were first blanked and normalized to loading control vinculin levels within lanes, then normalized to levels in parental OCI-AML2 cells and shown as fold change in expression.

Validation of CRISPR screen hits for resistance to the Ven + ruxolitinib combination. A, Immunoblot analysis of OCI-AML2 cells transduced with two independent guide RNAs for genes identified in the Ven + ruxoltinib CRISPR/Cas9 resistance screen. Cells were lysed, subjected to SDS-PAGE, transferred to PVDF membranes, and probed for levels of MED13L, MDM2, and MEIS2; vinculin was used as a protein loading control. Parental denotes untransduced OCI-AML2 cells; NT, nontargeting control guide. B, TIDE sequencing comparisons of genomic loci for MED13L, MDM2, and MEIS2 relative to parental OCI-AML2 controls following transduction and CRISPR modification. C, Dose-response curves for OCI-AML2 cells transduced as in B with two independent guide RNAs for MED13L, MDM2, and MEIS2 and tested for sensitivity to Ven, ruxolitinib, and Ven + ruxolitinib. Data points represent the mean normalized cell viability ± SEM for three replicates. Parental denotes untransduced OCI-AML2 cells; NT, nontargeting control guide. D, Immunoblot analysis of indicated proteins in OCI-AML2 parental and CRISPR knockout (KO) lines for MED13L, MDM2, or MEIS2. The vertical line denotes the cropping of nonadjacent lanes to juxtapose samples for ease of comparison. E, Quantification by densitometry of protein levels detected by immunoblot analysis in D. Band intensities were first blanked and normalized to loading control vinculin levels within lanes, then normalized to levels in parental OCI-AML2 cells and shown as fold change in expression.