Figure 6.
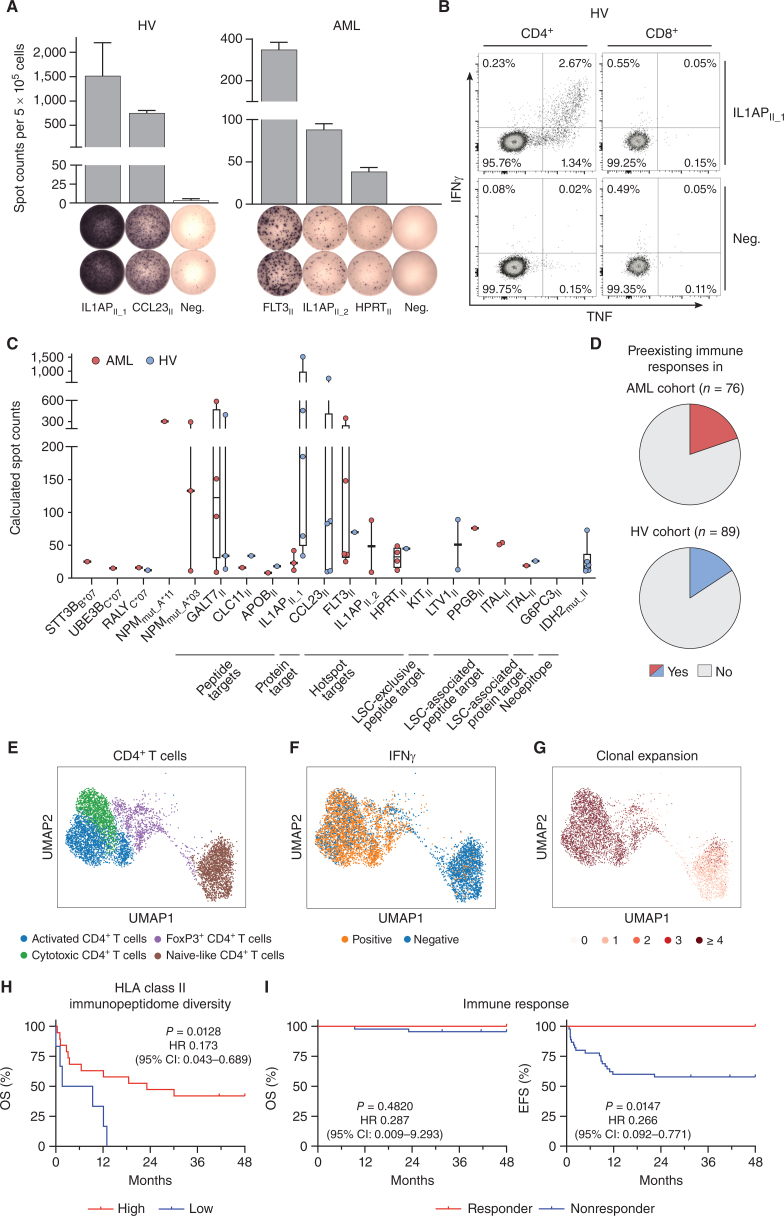
Immunogenicity analysis of HLA class II–restricted targets and impact of immunopeptidome diversity and peptide-specific immune responses on AML patient outcome. A and B, Detection of preexisting HLA class II peptide-specific T-cell responses by IFNγ ELISpot assay (A) and intracellular cytokine staining (B) after 12-day in vitro expansion using PBMC samples of HVs and patients with AML. Representative examples are depicted. Data are presented as bar graphs with mean and SD of duplicates. Graphs show single, viable cells stained for CD4 (left) and CD8 (right) and the cytokines IFNγ and TNF. Intracellular cytokine staining results for all analyzed samples are shown in Supplementary Fig. S10. C, Intensity of T-cell responses in terms of calculated spot counts in IFNγ ELISpot assays after 12-day stimulation against the respective AML- and AML/LSC-associated HLA class I and HLA class II–restricted antigenic peptide using PBMCs of AML patients and HVs. Dots represent data from individual donors. Data is shown for donors with T-cell responses. Boxes represent median and 25th to 75th percentiles, whiskers are minimum to maximum. D, Pie charts depicting the recognition rate (individuals with preexisting T-cell responses/tested individuals) of AML- and AML/LSC-associated peptides in PBMC samples of patients with AML and HVs as assessed by IFNγ ELISpot assay after 12-day in vitro expansion. Patients with AML and HVs were judged to possess preexisting immune responses when a positive T-cell response against at least one of the AML- and AML/LSC-associated peptides were observed in IFNγ ELISpot assays after peptide-specific 12-day in vitro expansion. T-cell responses were considered positive when >10 spots/500,000 cells were counted and the mean spot counts was at least three-fold higher than the negative control. E–G, scRNAseq analysis of CD4+ T cells of HLA class II AML/LSC peptide-stimulated and IFNγ secretion–based sorted PBMCs of patients with AML (n = 3) after 12-day in vitro expansion. E, Uniform Manifold Approximation and Projection (UMAP) plot showing the different subclusters of CD4+ T cells. Colors represent cell type classification. F, UMAP plot depicting the Boolean discretization of IFNγ+ CD4+ T cells. G, UMAP plot showing the TCR clonality of sequenced CD4+ T cells. Color code indicates the number of clonotypes per cell. H, Impact of HLA class II–restricted immunopeptidome diversity in terms of unique AML-exclusive HLA class II–restricted peptide presentation on overall survival (OS) of patients with AML (n = 25 total, n = 19 high, n = 6 low). Immunopeptidome diversity was classified as low and high according to the median peptide yields in the AML immunopeptidome cohort. I, Retrospective correlation analysis revealing the impact of preexisting antigen-specific T-cell responses as assessed by IFNγ ELISpot assay after 12-day in vitro expansion against HLA class II–restricted AML/LSC-associated peptides on OS (left) and event-free survival (EFS, right) of patients with AML (n = 56 total, n = 11 responder, n = 45 nonresponder). Patients with AML were classified as responders when they showed a positive T-cell response against one or multiple of the HLA class II–restricted AML/LSC-associated peptides in IFNγ ELISpot assays after peptide-specific 12-day in vitro expansion. T-cell responses were considered positive when >10 spots/500,000 cells were counted and the mean spot counts was at least three-fold higher than the negative control. Kaplan–Meier analysis, log-rank test. Abbreviations: CI, confidence interval; neg., negative peptide; OS, overall survival; EFS, event-free survival.

