. 2023 Aug 14;22(11):1343–1351. doi: 10.1158/1535-7163.MCT-22-0805

Figure 1.

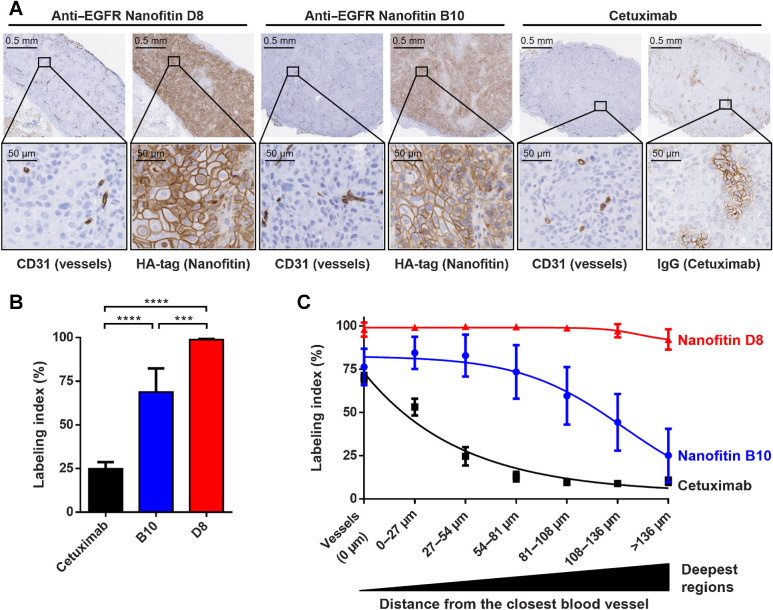
Figure 1. Intratumoral infiltration 90 minutres after systemic administration. A, Intratumoral infiltration of antiEGFR Nanofitins or Cetuximab, revealed by anti-HA and anti-IgG IHC, respectively. Host vasculature is revealed by anti-CD31 staining of consecutive slice sections. Zoom of selected regions illustrates EGFR labeling at the vessel proximity. B, Labeling index, on the basis of cells positively labeled, in the whole tumor. C, Labeling index relative to the distance from the closest blood vessel. ****, P < 0.0001; ***, P < 0.0005.

Intratumoral infiltration 90 minutres after systemic administration. A, Intratumoral infiltration of antiEGFR Nanofitins or Cetuximab, revealed by anti-HA and anti-IgG IHC, respectively. Host vasculature is revealed by anti-CD31 staining of consecutive slice sections. Zoom of selected regions illustrates EGFR labeling at the vessel proximity. B, Labeling index, on the basis of cells positively labeled, in the whole tumor. C, Labeling index relative to the distance from the closest blood vessel. ****, P < 0.0001; ***, P < 0.0005.