. 2023 Aug 21;83(21):3636–3649. doi: 10.1158/0008-5472.CAN-22-3402

Figure 6.

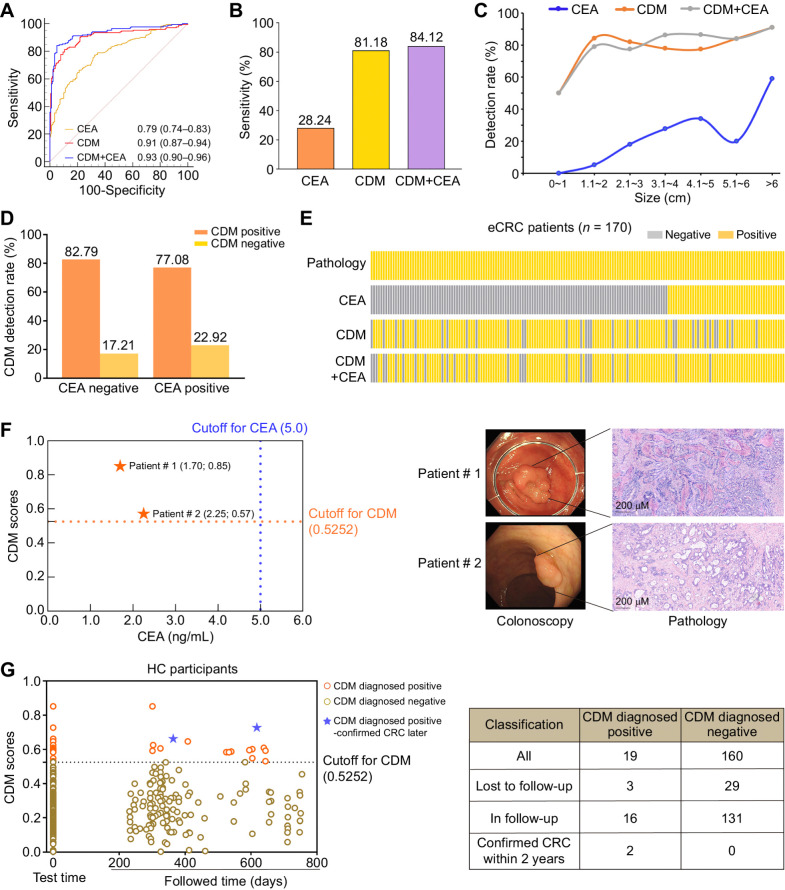
Figure 6. Performance evaluation of CDM in detecting early-stage colorectal cancer. A, The ROCs of CDM, CEA, or both for colorectal cancer versus healthy controls. B, The sensitivity of the CDM, CEA, or both in early-stage colorectal cancer cases were calculated by determined cut-off values (cut-off value for CDM = 0.5252; cut-off value for CEA = 5 ng/mL; cut-off value for CDM+CEA = 0.5776). C, Detection rates of CDM, CEA, or both in patients with early-stage colorectal cancer overall increased with tumor size. D, CDM detection rate in CEA-negative and CEA-positive early-stage colorectal cancer cases. E, For patients with early-stage colorectal cancer in cohort V, the real disease status and the disease status diagnosed by CDM and CEA, or both are shown in a waffle chart. Each column represents an individual participant. Gray, patients diagnosed as negative according to corresponding method; yellow, positive. F, Example of two patients with tumor detected by CDM but missed by CEA, who were later diagnosed by pathology. The magnifications of the images in pathology were ×20. G, Scatter plots of follow-up results of healthy control participants in cohort V diagnosed by CDM at the time of enrollment. CDM, CRC diagnostic model; CRC, colorectal cancer; eCRC, early-stage colorectal cancer; HC, healthy controls.

Performance evaluation of CDM in detecting early-stage colorectal cancer. A, The ROCs of CDM, CEA, or both for colorectal cancer versus healthy controls. B, The sensitivity of the CDM, CEA, or both in early-stage colorectal cancer cases were calculated by determined cut-off values (cut-off value for CDM = 0.5252; cut-off value for CEA = 5 ng/mL; cut-off value for CDM+CEA = 0.5776). C, Detection rates of CDM, CEA, or both in patients with early-stage colorectal cancer overall increased with tumor size. D, CDM detection rate in CEA-negative and CEA-positive early-stage colorectal cancer cases. E, For patients with early-stage colorectal cancer in cohort V, the real disease status and the disease status diagnosed by CDM and CEA, or both are shown in a waffle chart. Each column represents an individual participant. Gray, patients diagnosed as negative according to corresponding method; yellow, positive. F, Example of two patients with tumor detected by CDM but missed by CEA, who were later diagnosed by pathology. The magnifications of the images in pathology were ×20. G, Scatter plots of follow-up results of healthy control participants in cohort V diagnosed by CDM at the time of enrollment. CDM, CRC diagnostic model; CRC, colorectal cancer; eCRC, early-stage colorectal cancer; HC, healthy controls.