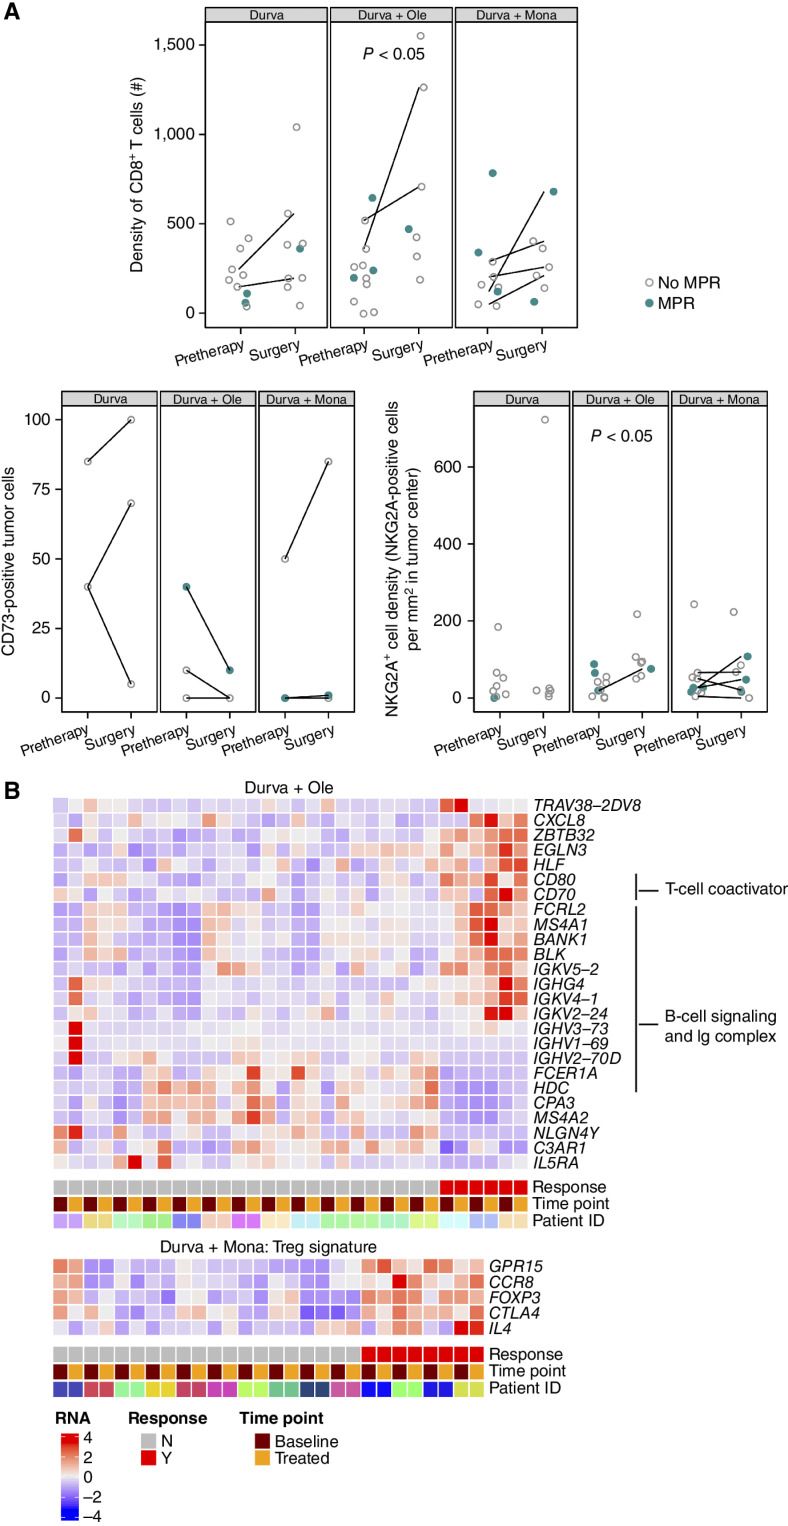
Figure 4.
Treatment-related changes in the tumor microenvironment by IHC; relationship of IHC and peripheral blood RNA biomarkers and MPR. A, IHC biomarkers are shown in all patients with evaluable tumor samples at pretherapy and surgery. Patients with MPR are indicated in closed teal circle; patients without MPR are indicated in open gray circle. Patients with paired samples (an evaluable sample from both pretreatment and surgery) are connected by a line. Top: CD8+ (SP239) T-cell density as number of positive cells/mm2 tumor area in all evaluable patients (n = 54 samples). Bottom left: Percentage of tumor cells positive for CD73 (D7F9A) at any intensity in paired cases only (n = 20 samples from 10 paired cases). Bottom right: NKG2A+ (AR9352) cell density as number of positive cells/mm2 tumor area (n = 49 samples). B, Heat map of selected genes that were significantly differentially expressed between patients with and without an MPR in analyses of patients with paired pretherapy and end-of-treatment samples (n = 54). These analyses identified numerous genes associated with T-cell coactivation, B-cell signaling, and Ig complex upregulated in the peripheral blood of patients with an MPR in the durvalumab + oleclumab arm (n = 16 paired cases). In the durvalumab + monalizumab arm, genes associated with regulatory T cells (Treg) are upregulated in patients with an MPR (n = 14 paired cases). Durva, durvalumab; Mona, monalizumab; Ole, oleclumab.

