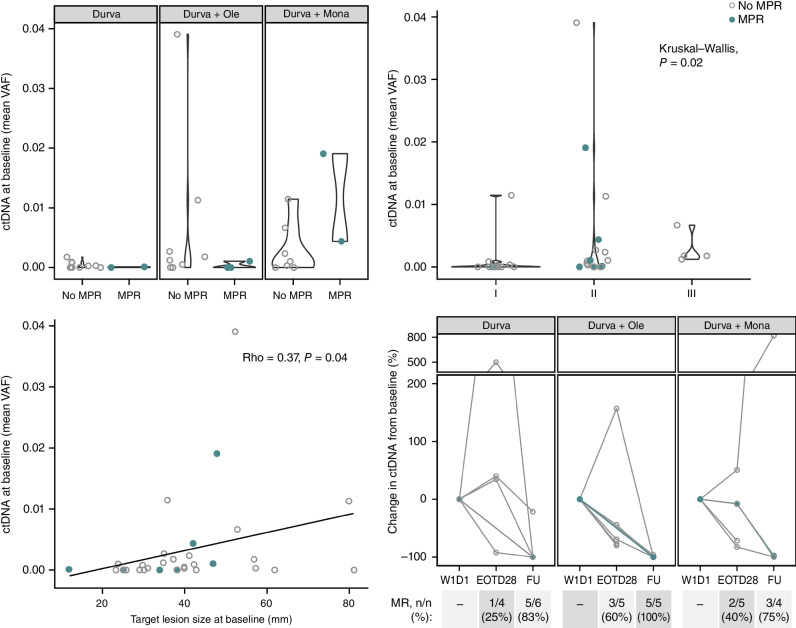
Figure 5.
ctDNA dynamics as surrogate for response. Patients with MPR are indicated in closed teal circle; patients without MPR are indicated in open gray circle. Top left: mean VAF at baseline is compared between patients with an MPR and with no MPR across all arms. Top right: mean VAF at baseline associated across stage I, II, or III disease. Bottom left: mean VAF at baseline correlated with the sum of diameters among target lesions at baseline (mm) (total patients with ctDNA evaluable at baseline N = 33; durvalumab monotherapy arm: n = 13; durvalumab + oleclumab arm: n = 11; durvalumab + monalizumab arm: n = 9). Bottom right: for patients with detectable ctDNA at baseline (total N = 20; durvalumab monotherapy arm: n = 6; durvalumab + oleclumab arm: n = 7, durvalumab + monalizumab arm: n = 7), molecular response (≥50% reduction in VAF from baseline) is depicted at end of treatment (EOT; day 28) and follow-up (FU; day 105) time points for all patients with evaluable ctDNA at those time points (N are depicted above). W1D1, week 1, day 1.

