. 2023 Aug 23;83(21):3577–3592. doi: 10.1158/0008-5472.CAN-23-0025

Figure 1.

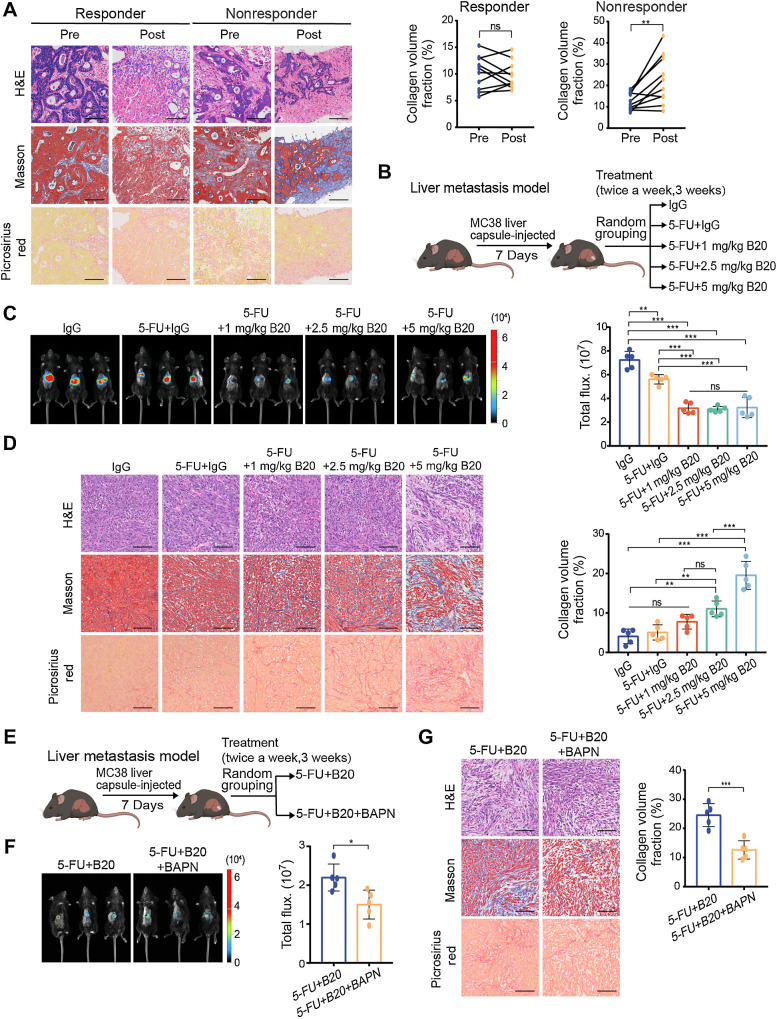
Figure 1. Bevacizumab increases ECM deposition in colorectal cancer liver metastases in a dose-dependent manner. A, Representative hematoxylin and eosin (H&E), Masson and picrosirius red (left) on serial sections showing ECM deposition change in liver metastases from patients with colorectal cancer before and after receiving chemotherapy and bevacizumab treatment. Quantification of intraindividual comparisons of collagen volume fraction (right) in paired samples (two-tailed paired t test; n = 10 per group). B, Schematic representation of the liver metastasis models used in C and D. Mice were given treatment with control IgG, 5-FU+IgG, 5-FU+1 mg/kg B20, 5-FU+2.5 mg/kg B20 or 5-FU+5 mg/kg B20 (5-FU 50 mg/kg; twice a week, 3 weeks). C, Representative in vivo bioluminescent images (left) and quantification of bioluminescent signals (right) of liver metastases in mice with indicated treatment (one-way ANOVA; n = 5 per group). D, Representative hematoxylin and eosin, Masson, picrosirius red images (left) on serial sections and quantification of collagen volume fraction (right) showing ECM deposition in liver metastases in mice with indicated treatment (one-way ANOVA; n = 5 per group). E, Schematic representation of the liver metastasis models used in F and G. Mice were administered 5-FU+B20 or 5-FU+B20+BAPN (5-FU, 50 mg/kg; B20, 5 mg/kg; BAPN, 100 mg/kg; twice a week, 3 weeks). F, Representative in vivo bioluminescent images (left) and quantification of bioluminescent signals (right) of liver metastases in mice with indicated treatment (two-tailed unpaired t test; n = 5 per group). G, Representative hematoxylin and eosin, Masson, picrosirius red images (left), and quantification of collagen volume fraction (right) showing ECM deposition in liver metastases in mice with indicated treatment (two-tailed unpaired t test; n = 5 per group). Data are graphed as the mean ± SD. Scale bar, 100 μm. ns, not significant; P > 0.05; *, P < 0.05; **, P < 0.01; ***, P < 0.001. (B and E, Created with BioRender.com.)

Bevacizumab increases ECM deposition in colorectal cancer liver metastases in a dose-dependent manner. A, Representative hematoxylin and eosin (H&E), Masson and picrosirius red (left) on serial sections showing ECM deposition change in liver metastases from patients with colorectal cancer before and after receiving chemotherapy and bevacizumab treatment. Quantification of intraindividual comparisons of collagen volume fraction (right) in paired samples (two-tailed paired t test; n = 10 per group). B, Schematic representation of the liver metastasis models used in C and D. Mice were given treatment with control IgG, 5-FU+IgG, 5-FU+1 mg/kg B20, 5-FU+2.5 mg/kg B20 or 5-FU+5 mg/kg B20 (5-FU 50 mg/kg; twice a week, 3 weeks). C, Representative in vivo bioluminescent images (left) and quantification of bioluminescent signals (right) of liver metastases in mice with indicated treatment (one-way ANOVA; n = 5 per group). D, Representative hematoxylin and eosin, Masson, picrosirius red images (left) on serial sections and quantification of collagen volume fraction (right) showing ECM deposition in liver metastases in mice with indicated treatment (one-way ANOVA; n = 5 per group). E, Schematic representation of the liver metastasis models used in F and G. Mice were administered 5-FU+B20 or 5-FU+B20+BAPN (5-FU, 50 mg/kg; B20, 5 mg/kg; BAPN, 100 mg/kg; twice a week, 3 weeks). F, Representative in vivo bioluminescent images (left) and quantification of bioluminescent signals (right) of liver metastases in mice with indicated treatment (two-tailed unpaired t test; n = 5 per group). G, Representative hematoxylin and eosin, Masson, picrosirius red images (left), and quantification of collagen volume fraction (right) showing ECM deposition in liver metastases in mice with indicated treatment (two-tailed unpaired t test; n = 5 per group). Data are graphed as the mean ± SD. Scale bar, 100 μm. ns, not significant; P > 0.05; *, P < 0.05; **, P < 0.01; ***, P < 0.001. (B and E, Created with BioRender.com.)