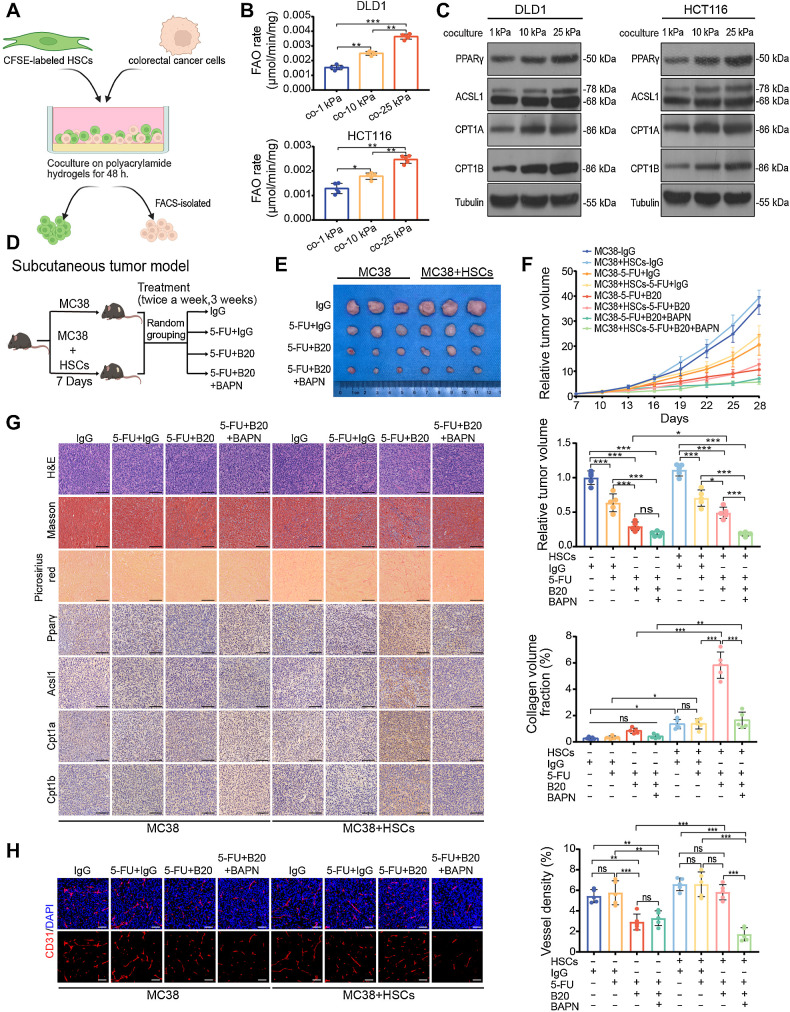
Figure 3.
HSCs are essential for matrix stiffness–mediated FAO metabolic reprogramming in colon cancer cells. A, Schematic representation of the HSCs-colon cancer cells coculture system. HSCs were labeled with CFSE before coculture with colon cancer cells for 48 hours on polyacrylamide hydrogels. B and C, FAO rate (B) and Western blot analysis (C) of DLD1 and HCT116 cells cocultured with LX-2 cells on 1 kPa, 10 kPa, and 25 kPa polyacrylamide hydrogels (one-way ANOVA; n = 5 independent experiments). D, Schematic representation of HSC/MC38 coinjection subcutaneous tumor models used in E–G. MC38 cells (0.5×10⁶) were subcutaneously injected with or without murine primary HSCs (0.5×10⁶) into C57BL/6 mice. After 7 days, mice were treated with IgG, 5-FU+IgG, 5-FU+B20, or 5-FU+B20+BAPN (5-FU 50 mg/kg, B20 5 mg/kg, BAPN 100 mg/kg; twice a week, 3 weeks). E, Representative images of subcutaneous tumors with indicated treatment. F, Relative tumor growth curves (top) and relative tumor volume (bottom) of subcutaneous tumors with indicated treatment (one-way ANOVA; n = 5 per group). G, Left, representative hematoxylin and eosin (H&E), Masson, picrosirius red images, and IHC images on serial sections of subcutaneous tumors with indicated treatment. Right, quantification of collagen volume fraction in subcutaneous tumors with indicated treatment. Scale bar, 100 μm (one-way ANOVA; n = 5 per group). H, Representative immunofluorescence images (left) showing tumor vessels (stained for CD31) and quantification of vessel density (right) in subcutaneous tumors with indicated treatment. Scale bar, 50 μm (one-way ANOVA; n = 5 per group). Data are graphed as the mean ± SD. ns, not significant; P > 0.05; *, P < 0.05; **, P < 0.01; ***, P < 0.001. (A, Created with BioRender.com.)

