. 2023 Aug 23;83(21):3577–3592. doi: 10.1158/0008-5472.CAN-23-0025

Figure 6.

Figure 6. Matrix stiffness activates lipolysis in HSCs. A, Representative images (left) and quantification (right) of lipid level in LX-2 cells culture on 1 kPa, 10 kPa, and 25 kPa polyacrylamide hydrogels (one-way ANOVA; n = 5 independent experiments). B, Western blot analysis of lipolytic genes in LX-2 cells cultured on 1 kPa, 10 kPa, and 25 kPa polyacrylamide hydrogels. C, Representative images (top) and quantification (bottom) of lipid level in LX-2 cells cultured on indicated stiffness after treatment with DMSO or 10 μmol/L atglistatin (ATGLi) for 24 hours (one-way ANOVA; n = 5 independent experiments). D, Representative images (top) and quantification (bottom) of labeled lipids within DLD1 and HCT116 cells, after coculturing for 48 hours with LX-2 cells that were prestimulated with indicated treatment (one-way ANOVA; n = 5 independent experiments). E and F, FAO rate (E) and Western blot analysis (F) of DLD1 and HCT116 cells treated with indicated CM (one-way ANOVA; n = 5 independent experiments). Data are graphed as the mean ± SD. Scale bar, 5 μm. *, P < 0.05; **, P < 0.01; ***, P < 0.001.

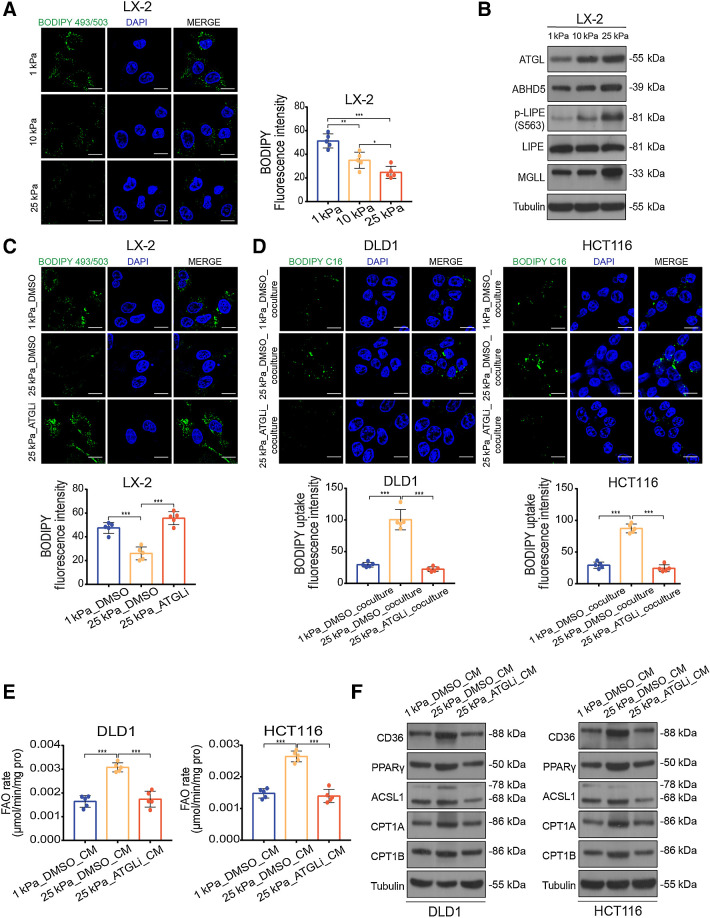
Matrix stiffness activates lipolysis in HSCs. A, Representative images (left) and quantification (right) of lipid level in LX-2 cells culture on 1 kPa, 10 kPa, and 25 kPa polyacrylamide hydrogels (one-way ANOVA; n = 5 independent experiments). B, Western blot analysis of lipolytic genes in LX-2 cells cultured on 1 kPa, 10 kPa, and 25 kPa polyacrylamide hydrogels. C, Representative images (top) and quantification (bottom) of lipid level in LX-2 cells cultured on indicated stiffness after treatment with DMSO or 10 μmol/L atglistatin (ATGLi) for 24 hours (one-way ANOVA; n = 5 independent experiments). D, Representative images (top) and quantification (bottom) of labeled lipids within DLD1 and HCT116 cells, after coculturing for 48 hours with LX-2 cells that were prestimulated with indicated treatment (one-way ANOVA; n = 5 independent experiments). E and F, FAO rate (E) and Western blot analysis (F) of DLD1 and HCT116 cells treated with indicated CM (one-way ANOVA; n = 5 independent experiments). Data are graphed as the mean ± SD. Scale bar, 5 μm. *, P < 0.05; **, P < 0.01; ***, P < 0.001.