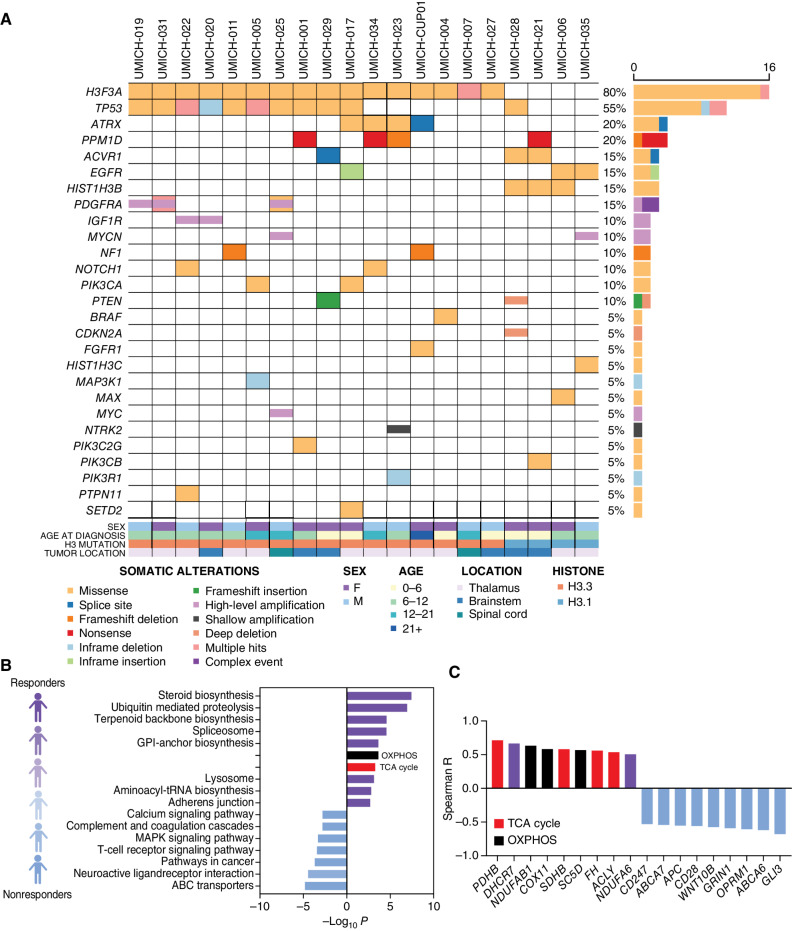
Figure 3.
Molecular attributes of trial patients with H3K27M-DMG treated with ONC201. A, Somatic driver gene alterations in the UMich cohort (n = 20, nonrecurrent H3K27M-DMG) treated with ONC201 for whom baseline DNA (n = 20)/mRNA (n = 13) sequencing was obtained. B, Correlation between individual gene expression levels (RNA) and best tumor response (defined as percentage radiographic reduction in tumor area relative to diagnosis) was performed in nonrecurrent H3K27M-DMG (n = 13). Bar graph depicts GSEA of genes associated with positive (top 500 genes, purple; red = TCA cycle; black = OXPHOS) or negative (bottom 500 genes, light blue) correlation with radiographic response to ONC201 treatment. C, Representative significant TCA cycle–related (red), OXPHOS (black), and other genes with positive (purple) or negative (light blue) correlation (Y-axis, Spearman correlation coefficient R).

