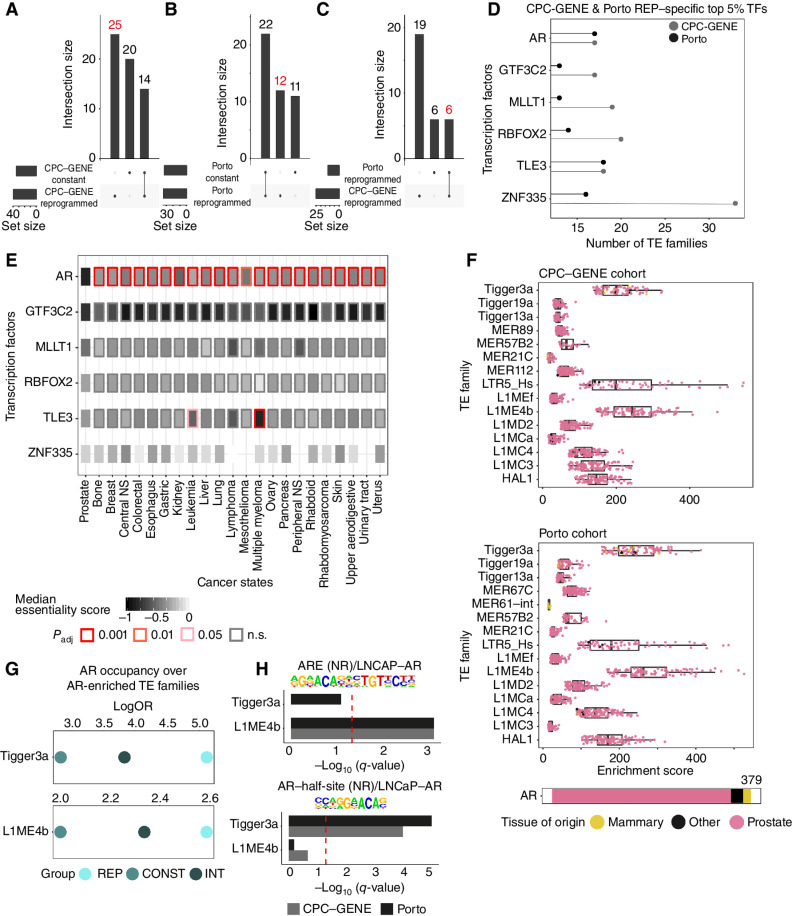
Figure 4.
Reprogrammed TE families act as binding sites for AR. A and B, UpSet plot showing the intersection of transcription factor cistromes found in the top 5% most frequent cistromes enriched over reprogrammed TE families in reprogrammed or constant patients (CPC-GENE in A and Porto in B).Red font highlights the sets of transcription factor cistromes of interest (unique to reprogrammed CPC-GENE or Porto prostate cancer patients). C, UpSet plot showing the intersection of transcription factors commonly found in the top 5% most frequent cistromes enriched over reprogrammed TE families in the reprogrammed subgroup (CPC-GENE and Porto) but absent in the constant subgroup. Red font highlights the sets of transcription factor cistromes of interest (transcription factor cistromes common to reprogrammed CPC-GENE and Porto prostate cancer patients). The six factors labeled in red are then used for D and E. D, Frequency of transcription factor cistromes (TF) enriched at reprogrammed TE families in reprogrammed CPC-GENE and Porto patients. The top 5% most frequently enriched transcription factor cistromes specific to reprogrammed patients is shown. E, Overview of essentiality scores of TFs in D across all cancer types available in DepMap with more than five cell lines, based on RNAi data. The distribution of the essentiality scores of each transcription factor calculated in prostate cancer cell lines was compared with the distribution of the same transcription factor calculated in each other cancer state cell line. Rectangle inner color corresponds to median essentiality score, while border color corresponds to pairwise t test Benjamini–Hochberg–corrected P values (Padj). NS, nervous system; n.s., not significant. F, Individual AR cistromes enriched over reprogrammed TE families with enrichment of AR cistrome shown in B. Box plots showing enrichment GIGGLE scores of individual AR cistromes profiled in cell lines derived from prostate, mammary, or other tissue state in CPC-GENE (top) or Porto (bottom) reprogrammed patients. Note that the Tigger3a, L1ME4b, and LTR5_Hs TE families are the top three TE families for enrichment of AR cistromes. G, Enrichment of AR cistromes profiled in reprogrammed (REP), intermediate (INT), and constant (CONST) Porto patients at the Tigger3a and L1ME4b TE families. H, Enrichment of AR DNA recognition sequences within Tigger3a and L1ME4b TE families. Bars represent −log10(q-value) for CPC-GENE or Porto reprogrammed patients. The red dashed line corresponds to −log10(q-value) = 1.3 (q-value = 0.05) threshold; q-values correspond to Benjamini-corrected P values.

