. 2023 Aug 18;32(11):1591–1598. doi: 10.1158/1055-9965.EPI-23-0066

Figure 2.

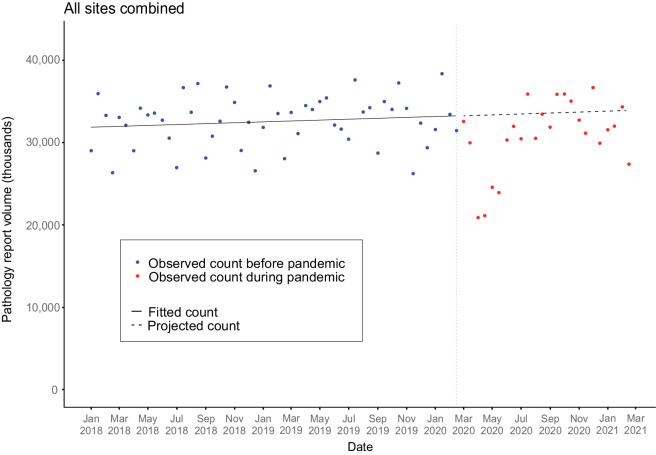
Figure 2. Observed and modeled volume of bi-monthly electronic pathology report for all cancer sites combined, January 2018 to February 2021 from 11 SEER registries (>3 million reports). This figure shows the observed counts based on more than 3 million pathology reports from 11 registries, as well as the projected counts, for all cancer sites combined. The solid-line, representing the fitted model, passes through the observed data with symmetric residuals. The dash-line is the projection count. Each month has two data points.

Observed and modeled volume of bi-monthly electronic pathology report for all cancer sites combined, January 2018 to February 2021 from 11 SEER registries (>3 million reports). This figure shows the observed counts based on more than 3 million pathology reports from 11 registries, as well as the projected counts, for all cancer sites combined. The solid-line, representing the fitted model, passes through the observed data with symmetric residuals. The dash-line is the projection count. Each month has two data points.