. 2023 Aug 18;32(11):1591–1598. doi: 10.1158/1055-9965.EPI-23-0066

Figure 3.

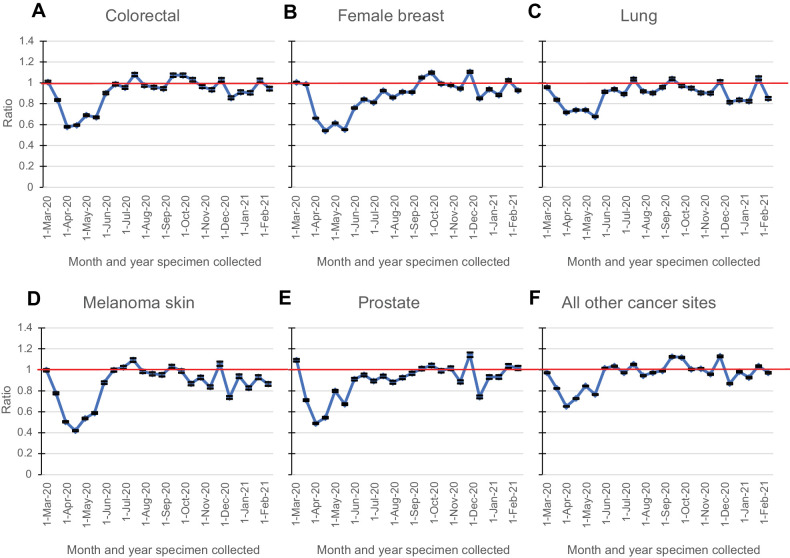
Figure 3. Observed to expected ratio, by cancer site (A, colorectal; B, female breast; C, lung; D, melanoma skin; E, prostate; F, all other cancer sites), month and year of diagnosis. The observed 2020 count was compared to the expected count by ratio (O/E ratio) from March 2020 to February 2021. The SE for the ratio was obtained by the delta method, which was used to determine the P value and 95% confidence interval for each O/E ratio. Horizontal solid line depicts an O/E ratio of 1.

Observed to expected ratio, by cancer site (A, colorectal; B, female breast; C, lung; D, melanoma skin; E, prostate; F, all other cancer sites), month and year of diagnosis. The observed 2020 count was compared to the expected count by ratio (O/E ratio) from March 2020 to February 2021. The SE for the ratio was obtained by the delta method, which was used to determine the P value and 95% confidence interval for each O/E ratio. Horizontal solid line depicts an O/E ratio of 1.