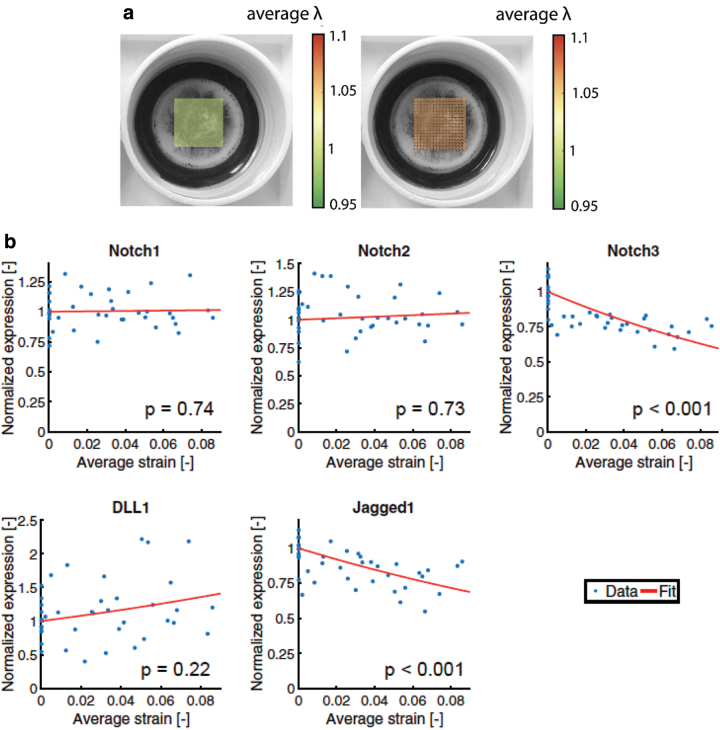
FIG. 7.
(a) Digital image correlation to quantify stretch λ applied to elastic culture membranes on which the smooth muscle cells have been cultured. (b) Changes in Notch receptor expression and DLL1 and Jagged1 ligands as a function of average strain applied. Reprinted (adapted) from Loerakker et al.151 with permission from Proceedings of the National Academy of Sciences. Color images are available online.

