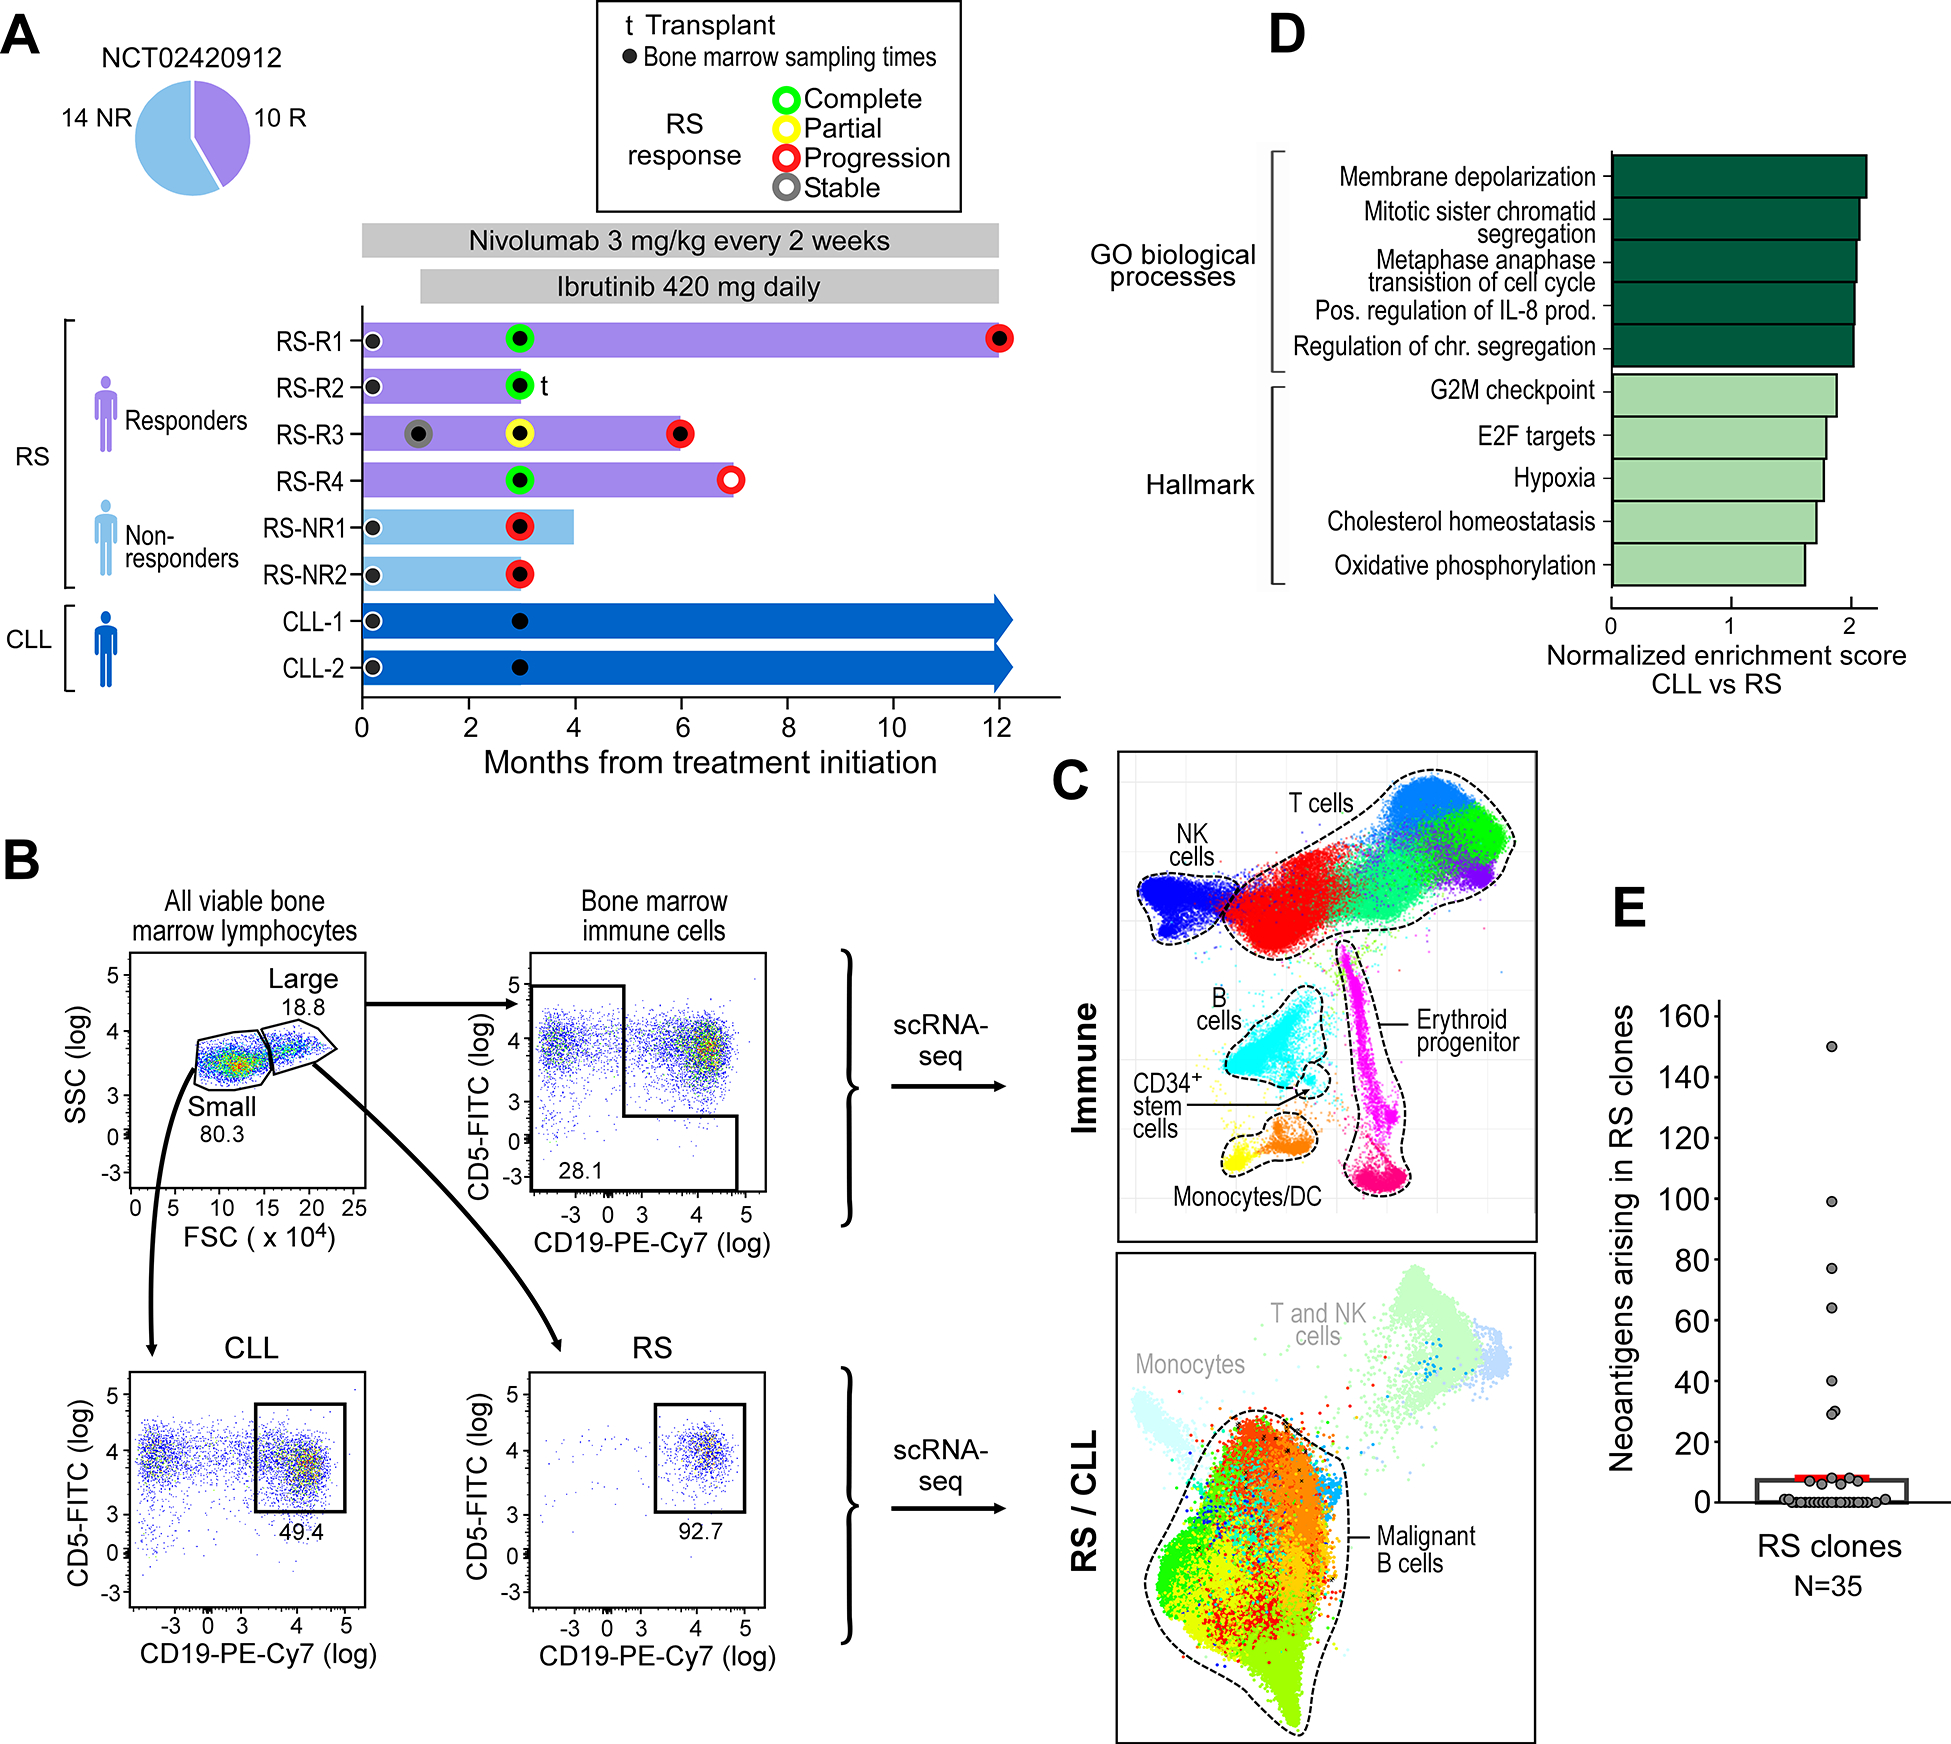
Figure 1. Single-cell RNA-sequencing cohort for determinants of response to PD-1 blockade.

(A) Response data (pie chart) for RS arm of NCT 02420912 and Swimmer’s plot showing the 8 patients with RS/CLL included in the discovery cohort and treatment schema (gray bars). RS responders are represented in purple, RS non-responders are represented in light blue and relapsed/refractory patients with CLL in dark blue. Marrow sampling times are indicated by black circles and responses by green (complete), yellow (partial), red (progression) and gray (stable) overlying circles.
(B) Experimental schema showing flow cytometry sorting strategy of populations used for single-cell RNA-sequencing experiments followed by analytic strategy.
(C) LargeVis embedding displaying joint clustering of tumor and immune cell populations.
(D) GSEA analysis shows differences between tumor transcriptome of RS vs. CLL.
(E) Difference in predicted neoantigen burden (HLAthena, binding threshold <2) between antecedent CLL clones and RS clones (n=35).
