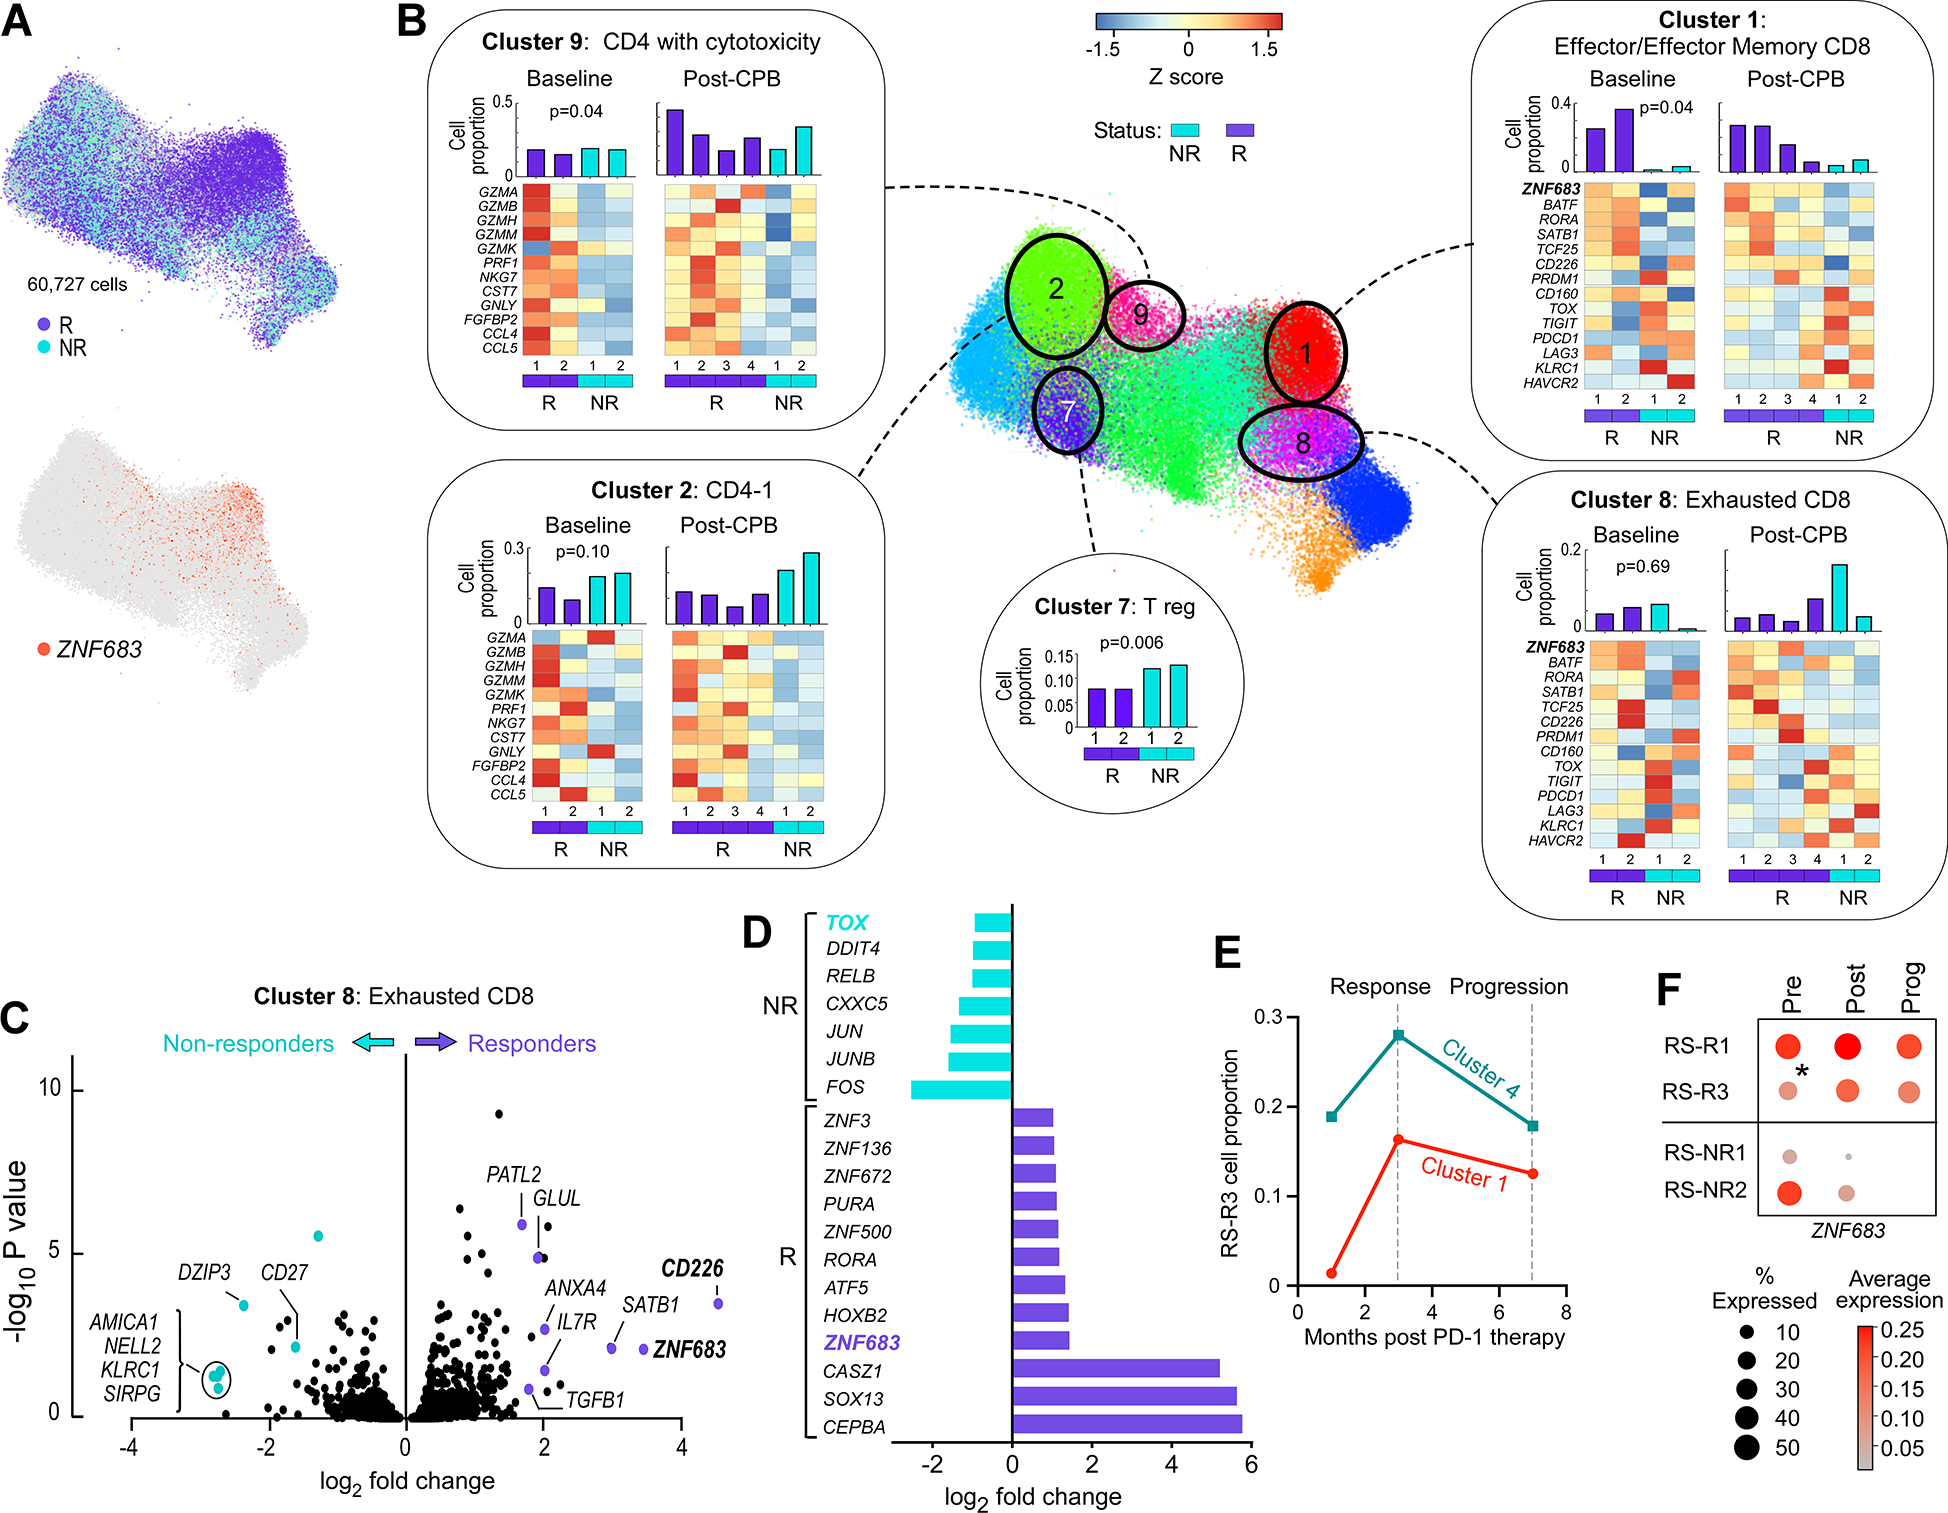
Figure 3. Gene expression changes associated with PD-1 response.

(A) Joint graph LargeVis sub-clustering embedding showing RS-R (purple) and RS-NR (light blue) cells as well as ZNF683-expressing cells (red).
(B) Cluster proportions for RS-R (purple) and RS-NR (blue) in bar graphs at top with heat maps showing representative cytotoxicity, exhaustion and expression changes within circled clusters for RS-R and RS-NR. Heat map values represent expression Z scores.
(C) Volcano plot showing gene expression differences comparing RS-R to RS-NR cells in Cluster 8 Exhausted.
(D) Top differentially expressed transcription factors in comparison of gene expression data in total CD8 T cells between RS-R and RS-NR.
(E) Kinetics of cluster 1 and 4 cell proportion at on-treatment, response and progression time points in RS-R3.
(F) Bubble plot showing percent expressing and average relative expression for patients with RS with progression on PD-1 blockade.
