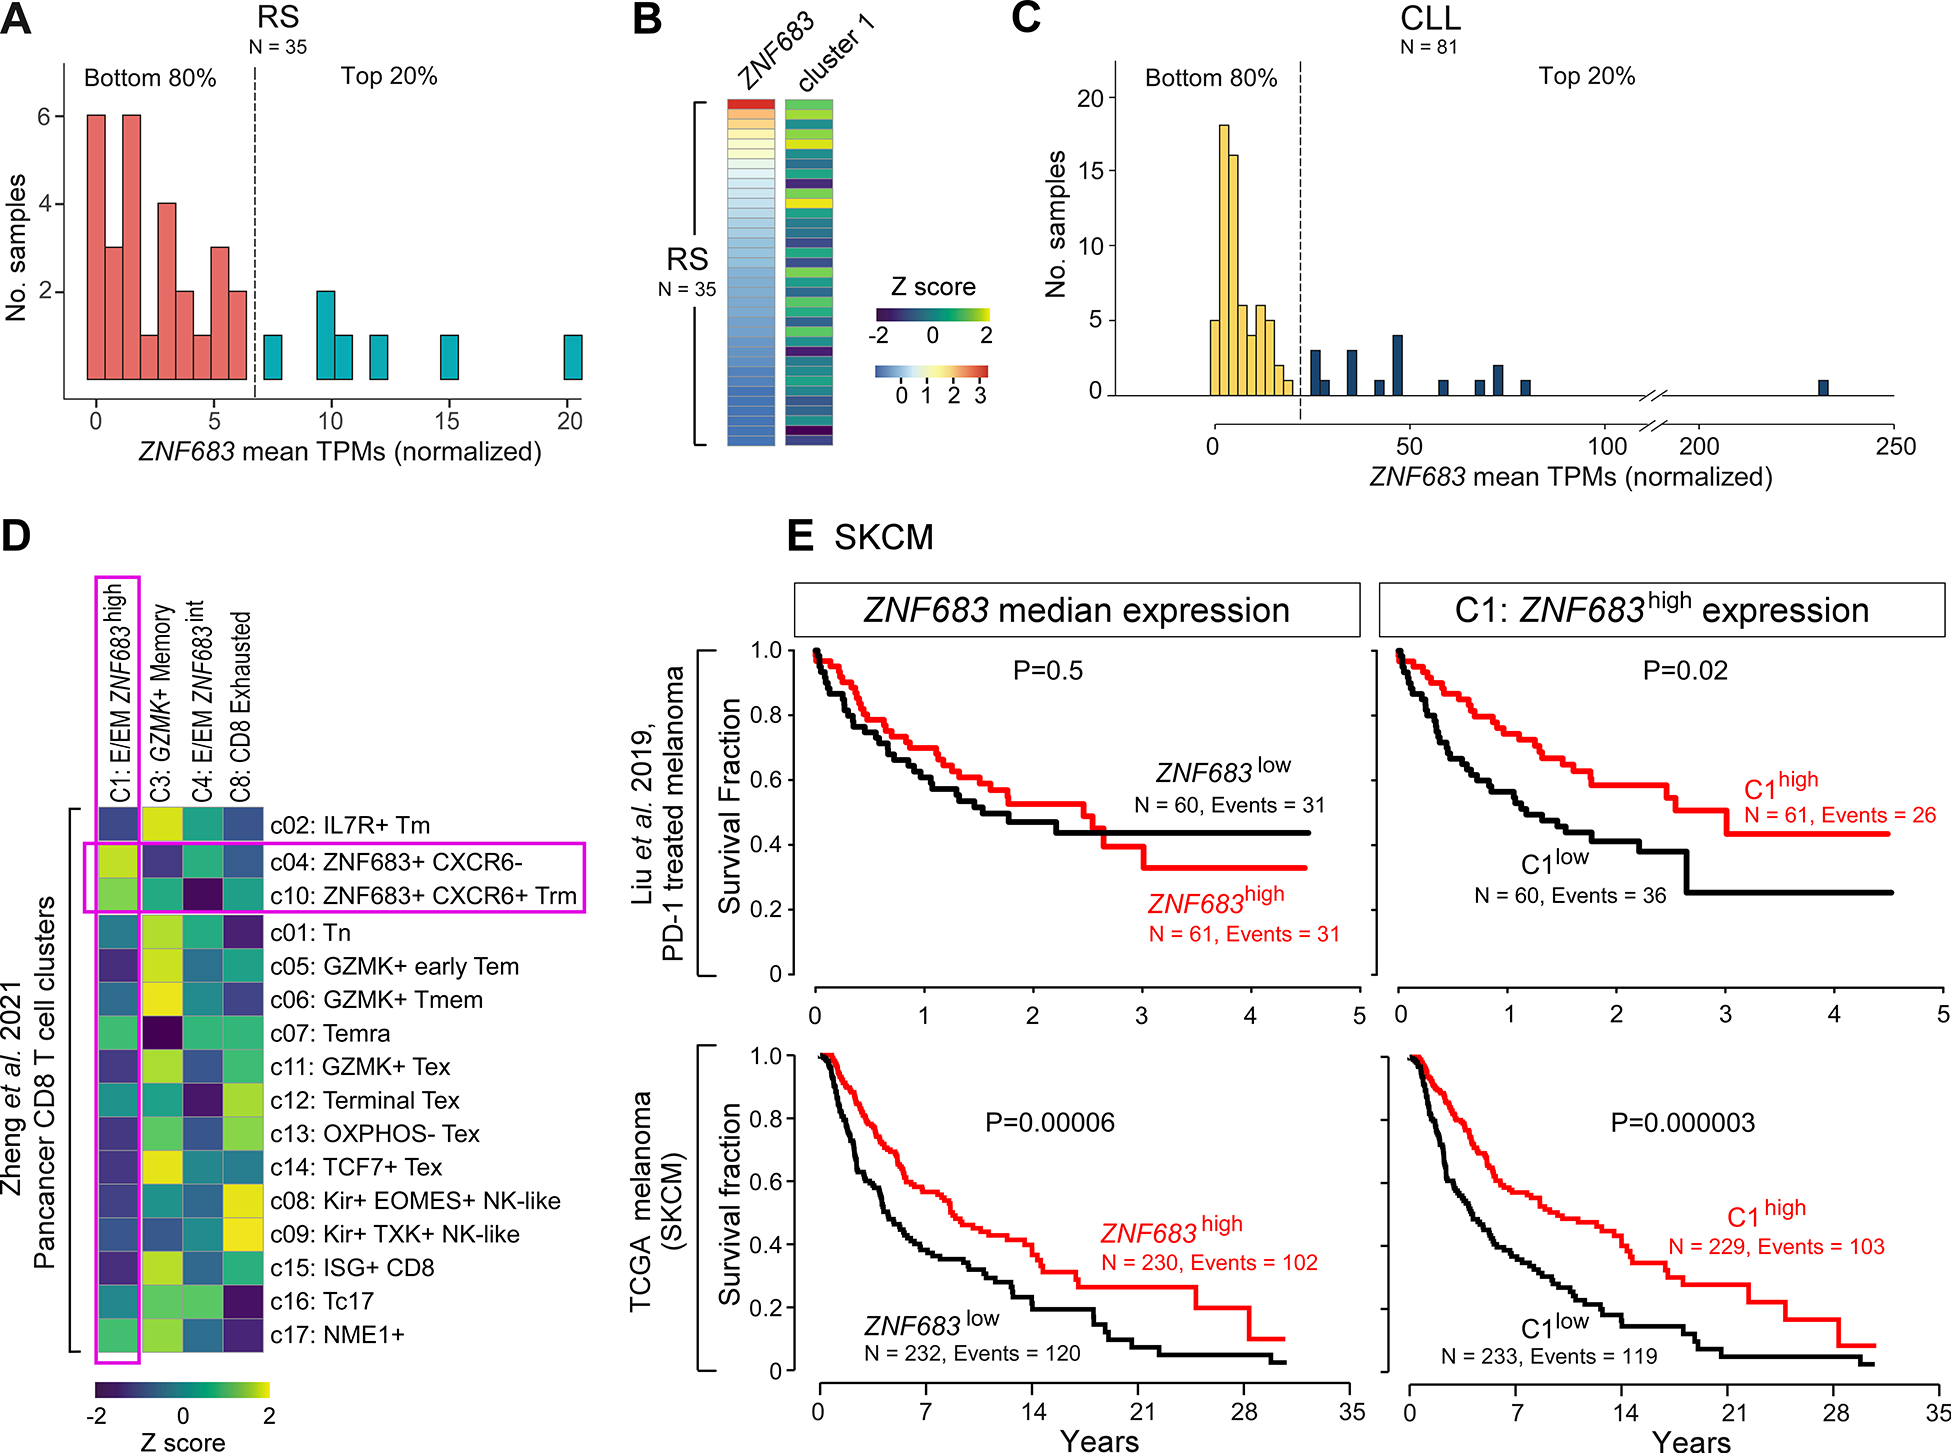
Figure 5. ZNF683 marks a distinct population in RS and CLL with prognostic significance.

(A) ZNF683 TPMs corrected for T cell content in RS bulk RNA-seq samples (N=35) (top). Top 20% of samples, blue; bottom 80%, pink.
(B) Cluster 1-ZNF683high signature and ZNF683 expression normalized for T cell content in bulk-RNA-seq data from 35 independent patients with RS (bottom).
(C) ZNF683 TPMs corrected for T cell content in CLL bulk-RNA-seq samples (n=81) (top). Top 20% of samples, blue; bottom 80%, yellow.
(D) Heatmap showing Z scores of single-sample GSEA scores for identified CD8+ T cell clusters as compared to Pancancer analysis CD8+ T cell clusters (Zheng et al., 2021).
(E) Survival curve showing ZNF683 expression and C1 gene expression signature with overall survival in PD-1 treated27 (top) and TCGA melanoma (bottom) data.
