
Figure 2. VIP interneuron ablation alters the size-tuning properties of SST-INs and PNs.
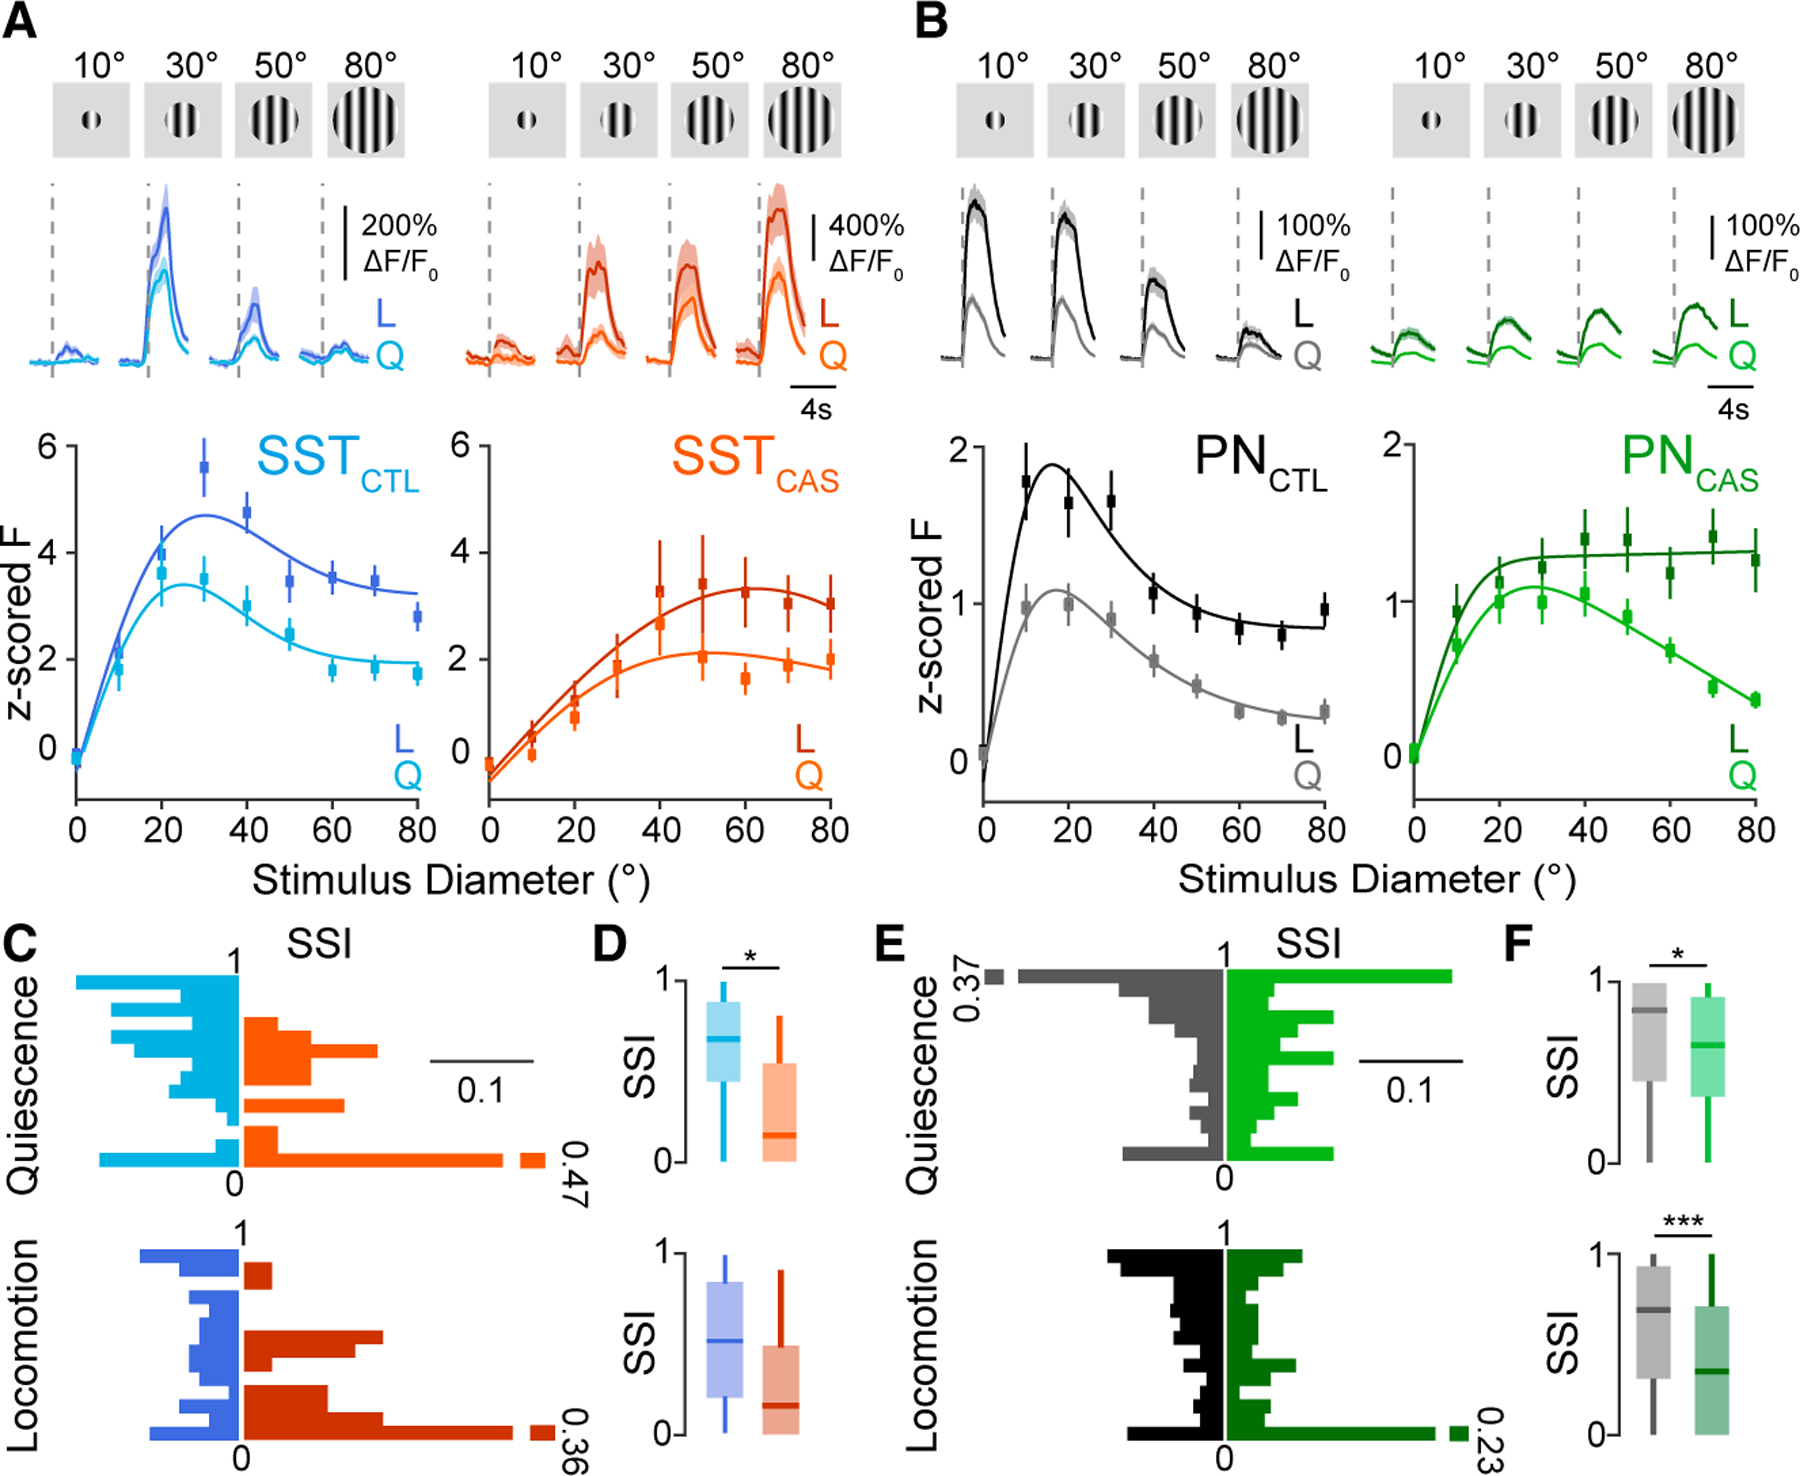
(A) Top: responses of example SST-INs to drifting grating stimuli of varying sizes in a control (left, blue; SSTCTL) and a VIP-ablation animal (right, orange; SSTCAS). Vertical dashed lines indicate visual stimulus onset. Responses during quiescence (Q,light traces) are shown separately from those during locomotion (L,dark traces). Shaded areas indicate mean ± SEM. Bottom: visual responses of SST cells Z scored to the 1 s baseline period before the stimulus onset for periods of Q (light lines) and L (dark lines) for control (blue) and VIP-ablation animals (orange).
(B) Same as in (A) but for PNs in control (gray; PNCTL) and VIP-ablation (green; PNCAS) animals.
(C) Probability distribution of the surround suppression index (), separated by L state, for SST-INs in control (blue; Q [top]: n = 86 cells, 6 mice; L [bottom]: n = 101 cells, 6 mice) and VIP-ablation animals (orange; Q [top]: n = 36 cells, 4 mice; L [bottom]: n = 30 cells, 4 mice).
(D) Boxplot of the during Q (top) and L (bottom).
(E and F) Same as in (C) and (D) but for PNs in control (gray; Q [top]: n = 279 cells, 6 mice; L [bottom]: n = 314 cells, 6 mice) and VIP-ablation (green; Q [top]: n = 175 cells, 5 mice; L [bottom]: n = 165 cells, 5 mice) animals. *p < 0.05, ***p < 0.001, 0/1 inflated beta mixed-effects regression model, with experiment type (control or VIP ablation) as fixed effect and mouse with nested imaging field of view as random effect.