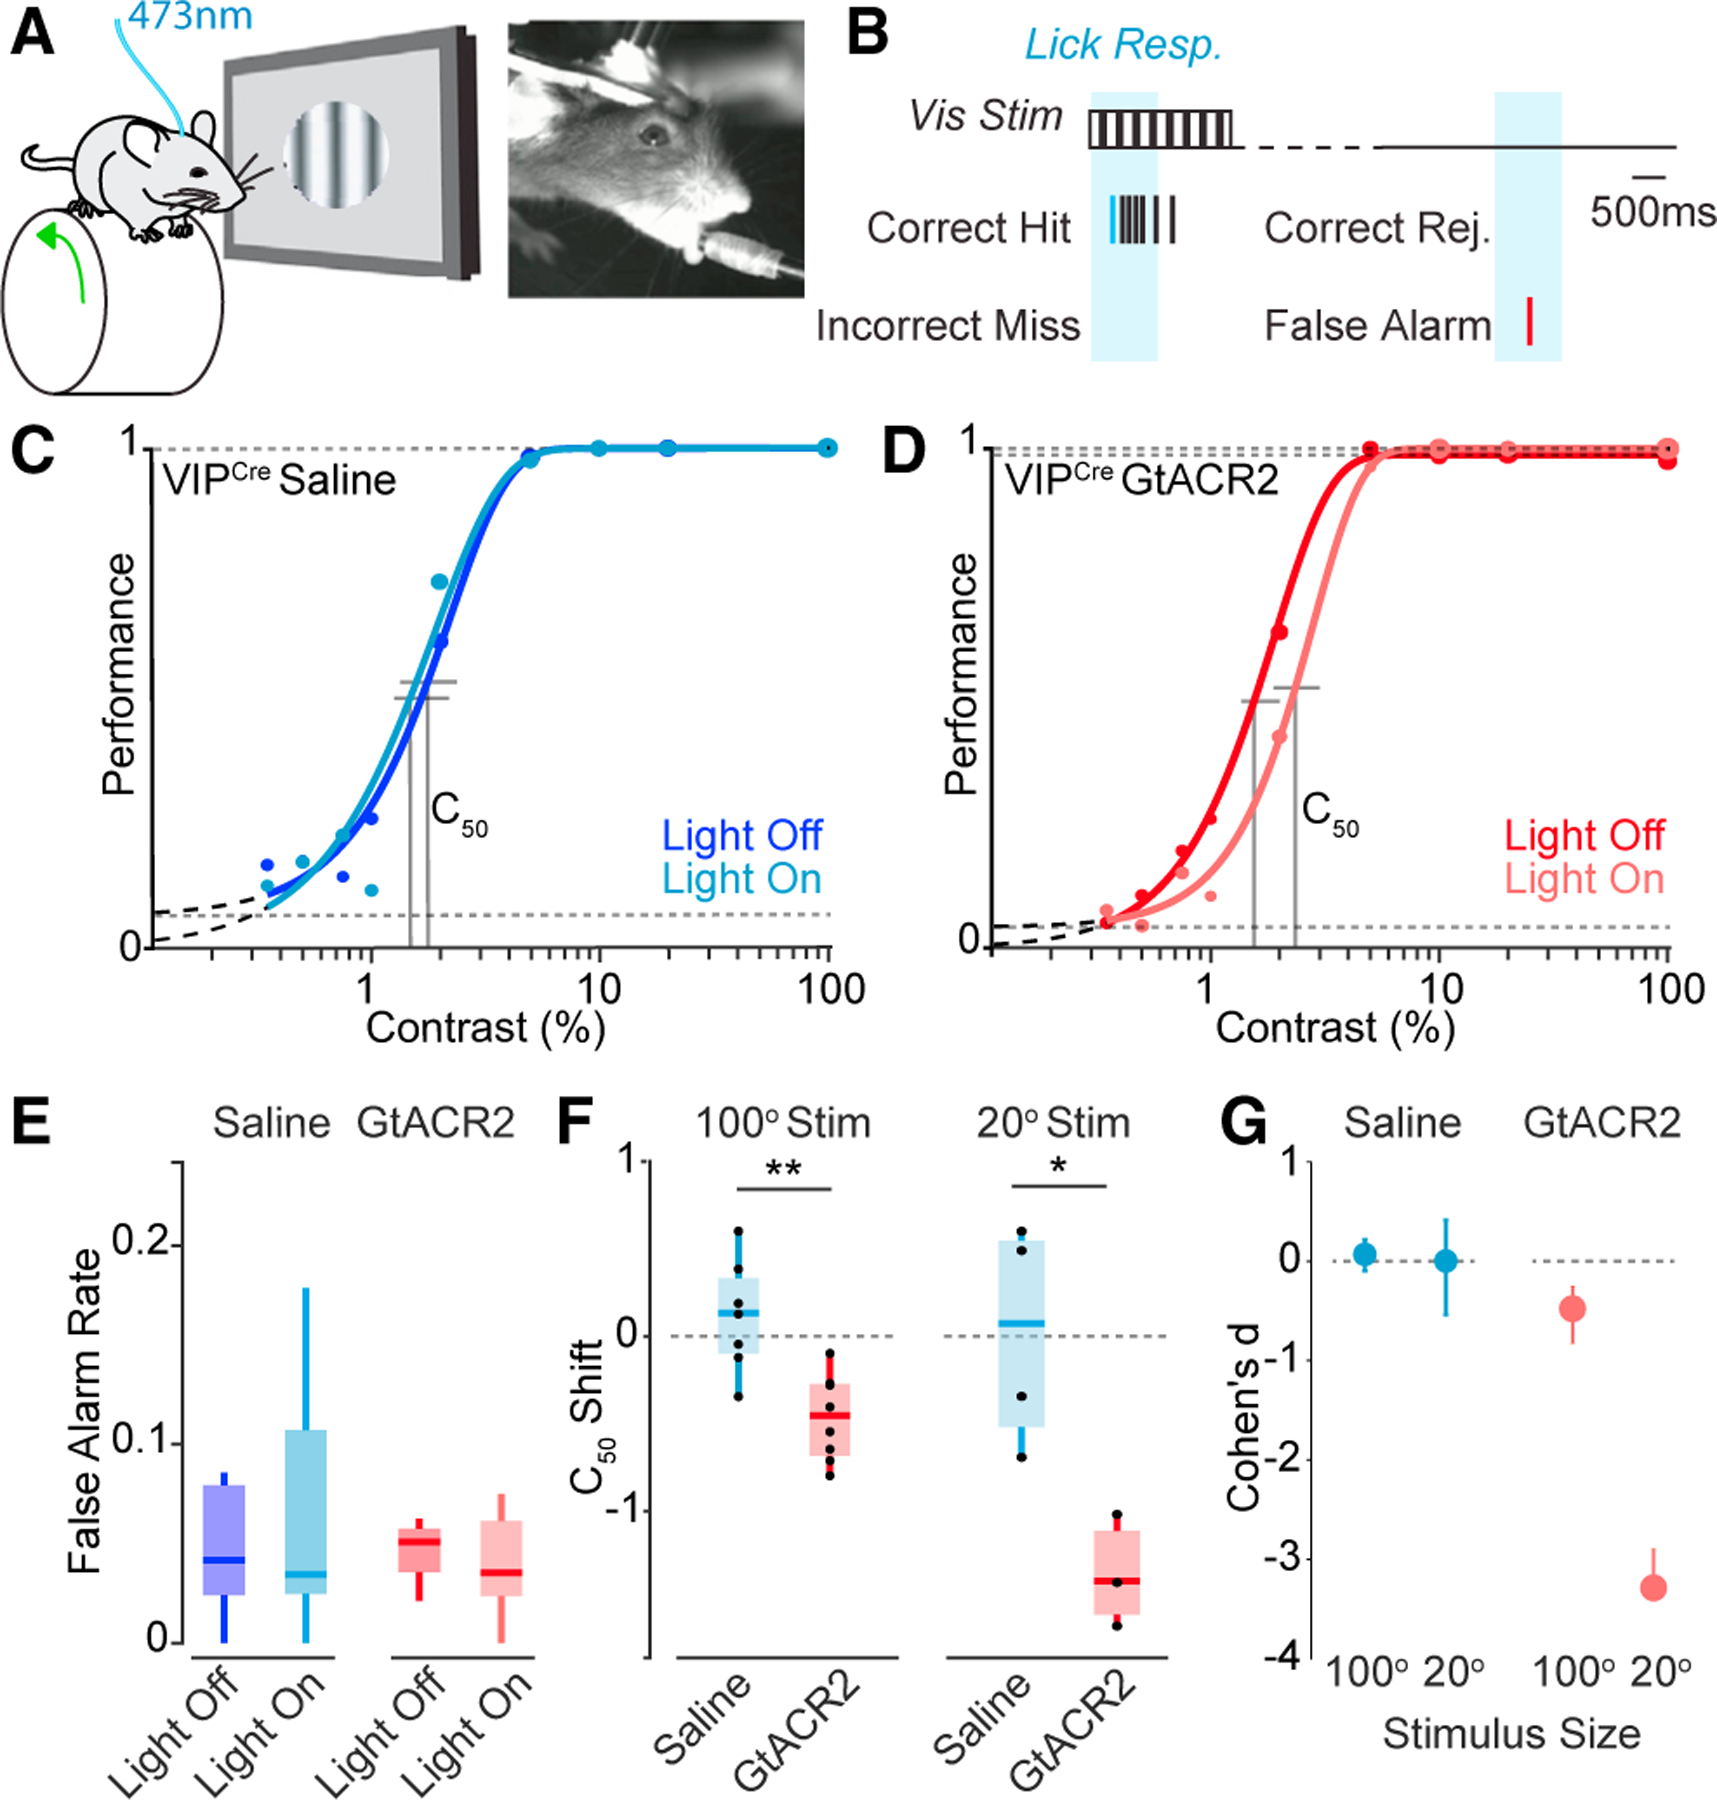
Figure 3. VIP-INs regulate visual perception in a size-dependent manner.

(A) Schematic of experimental paradigm with a freely running head-fixed mouse, lick spout, visual stimulation, and 473 nm optogenetic stimulation.
(B) Schematic of visual detection task.
(C) Psychometric responses for a representative mouse injected with saline. Darker shade indicates control trials, and lighter shade indicates trials with light pulse. The is represented by vertical lines.
(D) Psychometric responses for a representative mouse injected with the GtACR2 opsin for VIP inhibition upon light stimulation.
(E) False alarm rates for control (saline) and GtACR2 mice.
(F) shift (light off – light on ) for control and GtACR2 animals for small- (20°) and large-diameter (100°) stimuli.
(G) Cohen’s d effect size for small (20°) and large (100°) stimuli. 100° stimulus experiments: n = 7 control, 8 GtACR2 mice. 20° stimulus experiments: n = 4 control, 3 GtACR2 mice. *p < 0.05, **p < 0.01, Student’s t test.
